Partisanship generally varies more across pollsters than over time for a single pollster. This has implications for how we assess whether a poll has a reasonable partisan balance. (Hint: Double clicking on the figure gives a bigger image. Clicking on the image one more time magnifies it slightly, giving the optimal image quality, at least under Windows XP.)
The latest CBS/New York Times poll, 2/22-26/06, provoked a common criticism. Along with a low 34% approval rating for President Bush, the poll had a partisan split of 28.4% Republican, 34.2% Independent and 37.4% Democratic. Critics of CBS in particular were quick to seize on this as evidence of an "obvious" bias by CBS. But what should be the standard for partisanship against which we measure an individual poll? I expect that few commentators on this poll have a very clear picture of partisanship and how it varies across surveys. But such a perspective is crucial if we want to talk meaningfully about this topic. Starting with this post, and continuing for the next week or so, I will review some of the facts about partisanship in polls and compare the results across polling houses and over time. For today, we'll start with how partisanship varies across polling organizations, and put the new CBS poll in perspective.
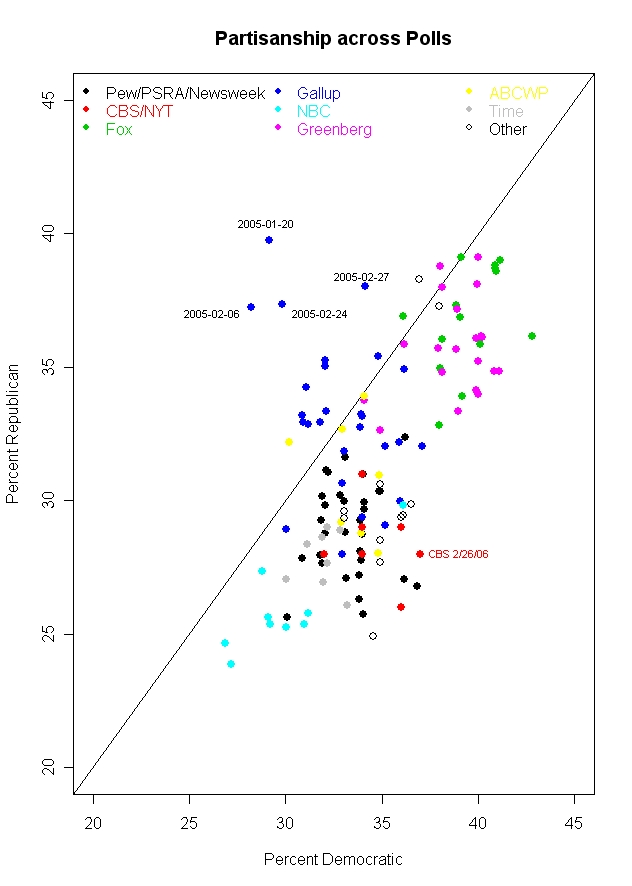
The most compelling point of the figure above is that polls from a single polling organization tend to cluster but that the organizations themselves tend to differ substantially. NBC and the Wall Street Journal, for example, tend to get a Republican-Democratic split of about 25% Rep-29% Dem. (These are medians across 2005-2006 polling, using questions that do NOT include leaners in the party categories.) At the other extreme Fox gets 37% Rep-39% Dem. Greenberg et al, a Democratic pollster, actually closely matches the supposedly conservative Fox with a split of 36% Rep-40% Dem. For CBS and the New York Times, the split is 28%R-34%D.
In fact, the variation within each polling organization is much smaller than the variation across all polls. Taking account only of the organization that conducted the poll accounts for 77% of the variance in Republican identification, and for 76% of the variance in Democratic identification. These "house effects" are a little stronger with the measurement of independents, where polling organization accounts for 80% of the variation.
So is this the smoking gun that demonstrates pollster bias? Not quite. A lot of the variation has to do with how many Reps and Dems there are. But if we switch to the party balance, making the difference between Reps and Dems the dependent variable, the house effect is less than half as much: 29% of the variance in the Rep-Dem difference is explained by polling organization.
Part of what is going on here are differences in question wording and sample frame. If the sample is of either registered or likely voters (as compared to adults) the poll boosts both Republican and Democratic percentages by about 3-4%, and decreases independents by about 4.5-6%. This is presumably due to the greater political involvement of likely and registered voters which results in stronger partisanship.
Question wording is the area where polls vary substantially and a considerable amount of variation in the results can be laid at the door of question wording. Fox, for example, gets high percentages of both Republicans and Democrats because their question omits the independent option:
"When you think about politics, do you think of yourself as a Democrat or a Republican?"
Survey respondents are often sensitive to question wording. Options not offered are options less chosen. How big can this effect be? Princeton Survey Research Associates, which polls for Pew, Newsweek and other clients, usually asks partisanship with the following question, reasonably similar to Fox's, but with an explicit independent option:
In politics today, do you consider yourself a Republican, Democrat, or Independent?
The difference: The median percentage of independents for Fox in 2005-06 was 17.5%. For Pew the median was 31%. That means that Fox has about 14% more "independents" who are fitting themselves into one of the partisan categories than Pew does. The result is that Fox gets a median of 37% Rep- 39% Dem, while Pew has it 30% Rep and 33% Dem.
Variation in questions also extends to whether respondents are offered an option for "something else", "none of these" or (literally!) "or what".
Here Pew's pollster, Princeton Survey Research Associates, gives us a comparison. Their usual question is
In politics today, do you consider yourself a Republican, Democrat, or Independent?
But in a poll taken 4/1-5/1/05 they varied the wording:
In politics today, do you consider yourself a Republican, a Democrat, an independent, or something else?
The difference? When given the option of "something else", 11% took it. When not offered the option in a PSRA poll taken at the same time (3/31-4/3/05), less than 1% volunteered that they thought of themselves as "something else". In this case, the percentage of Independents was substantially affected: 24% when "something else" was offered, 33% when it was not. The Republican and Democratic percentages were little affected however, 29% ("something else") and 28% (no "something else") Republican and 32% Democratic in both cases.
But house effects are not just due to question wording. NBC/Wall Street Journal (whose polls are done by a Dem-Rep polling pair of Peter Hart and Bill McInturff) also offers a "something else" option:
Generally speaking, do you think of yourself as a Democrat, a Republican, an independent, or something else?
But their results don't produce the high "something else" results that PSRA got (or that Time gets with a nearly identical question). The median NBC/WSJ "something else" response is only 4%. Time's median is 10%, close the the one result from PSRA.
NBC/WSJ also get more independents than most pollsters, though there is nothing obvious about their question that would account for this. The median independents for NBC/WSJ is 39% while for all other polls the median is 29%. That higher percentage of independents drives the NBC/WSJ percentages for each party down, and you can see the result in the figure: NBC/WSJ is at the lower left of the figure with the lowest Rep and Dem percentages of any poll. So why does NBC/WSJ produce these results when similar questions produce fewer independents and more partisans? It's a mystery. Sometimes house effects are like that.
Gallup appears somewhat unusual in the figure because a number of their polls in 2005 found more Republican than Democratic partisans. As the dates added to the figure point out, most of these polls were taken early in 2005, and Gallup (as we'll see in a later post) experienced some decline in estimated Republican identification over the year. The median Gallup results produced a 33% Rep-33% Dem-30% Ind split. (The Gallup data here end in September 2005, so if there is a trend these results may differ when the entire year can be considered. See the data note at the bottom of the post for more details.)
And so where does CBS/New York Times fit within this? The CBS median split is 28%R-34%D, while all other polls have medians of 32%R-34%D. So while CBS doesn't tend to be higher than other polls on the Democratic proportion, it does tend to be about 4% lower on the Republican percentage. If we consider the Republican minus Democratic difference, CBS has a median difference of -6%, compared to -3% for all other polls. Here is how the polls compare.
CBS/NYT -6
ABCWP -4
Fox -2
Greenberg -4
NBC/WSJ -4
Pew -4
Newsweek -4.5
PSRA -4
Time -3.5
Gallup -1
So CBS/NYT does turn out to produce polls that are about 2% more net Democratic than the median for all other polling. In a world of 3% margins of error, that isn't a lot but it is a persistent house effect that should be considered when comparing polls.
But the bottom line problem is, what is the "truth"? Maybe CBS has it right and everyone else is biased in favor of the Republicans. Maybe Gallup has it right and everyone else is biased towards the Democrats. Maybe the median is right with a -4 gap and polls vary a bit around this. The crucial point is that when we talk about vote outcomes, there is an objective "truth" (subject to counting errors!) that we can compare polls to. But when we talk about partisanship there is no objective standard by which to judge the polls. At best we can make relative comparisons.
The figure above should make this point. Estimates of partisanship vary widely. Using a 90% confidence interval, you could say that Republicans are between 26% and 39% of the public, Democrats are between 29.4% and 40.6% and Independents between 17.4% and 36.6%. Those are widely varying estimates. They get pushed around by question wording, sampling frame, house effects and plain random sampling error. To pick any single value for the party distribution and claim it is "right" in some absolute sense is fantasy.
What we can, and should, do is analyze the data and base our conclusions on the evidence. The variability we see in the figure shows pretty strongly that the variation from one CBS poll to another (or one Fox poll to another) is small compared to the variation across polling organizations. Analysis that takes account of house affects when comparing across polling houses is essential if we want to make solid inferences. Comparison within organization over time is also a good way to make an apples-to-apples comparison. But comparing one organization to another without some estimate of the house effect is asking to be mistaken. (And that is exactly what happens when readers pick the 34% from CBS but fail to consider the CBS house effect and other polls.)
More on partisanship and polling in the next few posts.
Data: The data here are for 129 national polls taken during 2005 and 2006. The data were gathered from the Roper Center's iPoll database and in some cases from the pollster's website. Unfortunately the data are not uniformly available across polling houses. For example, the Gallup data ends in September. Models that include a trend term suggest that this is not a substantial problem. Likewise the CBS/New York Times data are for joint surveys only. CBS News does not appear to post full topline results for their surveys, or at least I could not find them except for very recent polls. If anyone knows different, please let me know. CORRECTION: CBS News DOES indeed post the complete marginals, including their party id marginals. In fact, they are the only poll I found that shows both the weighted and unweighted party id distribution. The "topline" (or marginals) are available in a link either in the body of the story, usually about 1/3 of the way in, OR in a box on the left. I could not find results prior to September of 2005 on the CBS poll page, however. MY THANKS TO CBS for helping me see the links that are actually clearly there. My bad.
The CBS/NYT data came from the quite complete New York Times polling site. (I've not altered the post here but stayed with the joint data as posted on the NYT site. The NYT marginals leave "DK/NA/Some other party" as a separate category, while the CBS topline folds these into the independent category. There are therefore some significant differences in the percent Independent between the NYT and CBS websites. However, the Republican and Democat percentages are either identical or very similar. In later posts I'll use the CBS data as well.)
Click here to go to Table of Contents