The new AP/Ipsos poll is out, taken 7/10-12/06. The AP poll finds approval at 36% and disapproval at 63%. The 36% approval matches the results of the Fox poll completed 7/11-12. This is a 1 percentage point increase from AP's previous poll of 6/5-7.
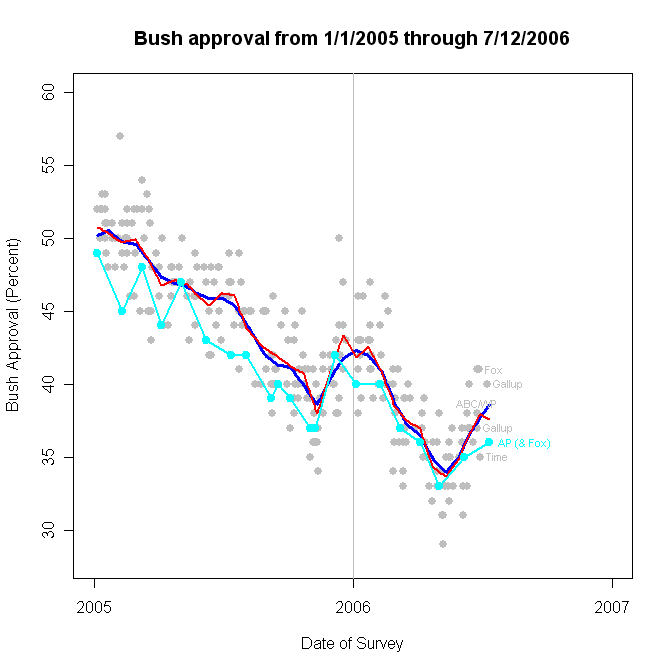
The four most recent polls have checked in at 35% (Time, 6/27-29), 40% (Gallup, 7/6-9), 36% (Fox) and 36% in this AP poll. Three of these are below my estimated trend, with only Gallup above the trend. (My estimated trend is the blue line in the figure.)
With the AP and Fox polls added to the dataset, the revised approval trend estimate of 7/12 stands at 38.6%. That's revised down from 39.4% yesterday (before adding AP) and down from 40.0% after Gallup's 40% result on Tuesday. With these revisions the blue trend line is still estimated to be continuing up, but clearly the two new polls reduce the estimated approval fom 40.0% to 38.6%.
The recent polls raise the question of whether the upturn in approval that began May 12 has now flattened or even turned down. The blue trend line doesn't suggest a downturn yet. However, as I've explained before, it takes between 6 and 12 polls before the blue trend is "convinced" that the change is real. For a more sensitive but also more gullible estimate, we turn to the red line estimate. That uses fewer polls in the estimate, so it is more sensitive to short term change. It also is more easily fooled by random noise. Since we now see three out of four polls below trend, it is time to bring the red line back to the analysis.
The red line estimate does show a very modest but clear downturn. The red line peaks at 37.9% on 6/29. It declines to 37.6% on 7/12 with the inclusion of both Fox and AP polls, a decline of 0.3%. For comparison, the blue line estimate is 37.7 and 38.6% for those two dates respectively. So the discrepancy between the two estimates is one percentage point as of today. That's not close to a statistically distinguishable difference. But the qualitative difference is important: the rougher red line fit suggests a downturn has begun while the more robust but less sensitive blue line says the improvement in approval that began in May continues.
At this point there is not enough data to be at all confident as to what is happening. The lack of polls in early July (due perhaps to the holiday on the 4th rather than the mainstream media conspiracy to suppress polls) has given us less leverage than we'd like to detect a change of trend. Some can't wait for an answer, but I'm content to see if blue and red lines continue to diverge over the next 6 or 8 polls. If so, or if blue turns down, then the President has lost his momentum. If red turns back up, then we probably just got a couple of low values by chance and old reliable blue has again shown it is better not to jump to conclusions. Alas patience is required in either case to know what is happening to approval.
Click here to go to Table of Contents