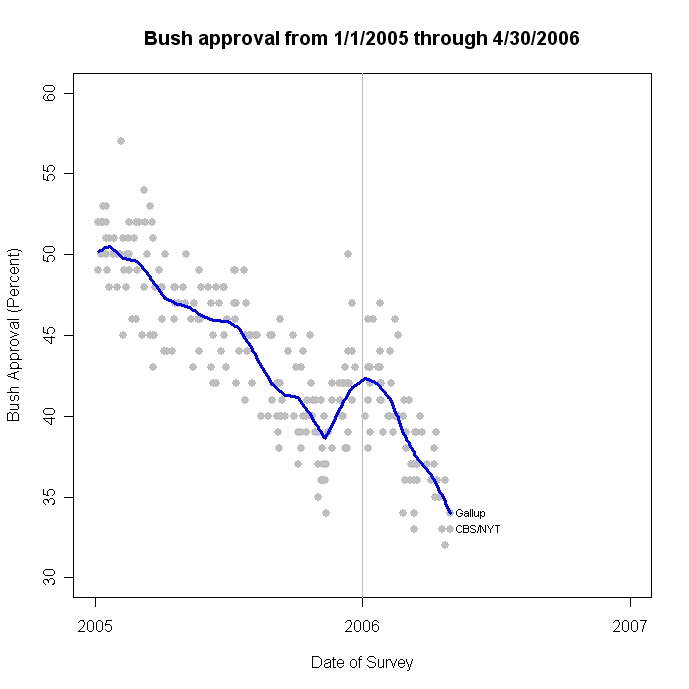
New polls from Gallup and CBS provide evidence that President Bush's approval rating continues to erode. Gallup/USAToday's 4/28-30/06 poll finds 34% approval and 63% disapproval, while CBS's survey, also conducted 4/28-30 finds 33% approval and 58% disapproval. Both polls are below my estimate from last week of 35% approval. With the addition of these two new polls, my trend estimate now stands at 33.98% approval. UPDATE 5/2, 9:26 pm: Cook/RT strategies poll is out: 36% approve, 59% disapprove. Cook has a +1.48 house effect, so with that removed they are at 34.52%-- no real change to the estimates presented here. All the results below do NOT include the Cook poll but should not be much affected by it.
From January to mid-November 2005, my linear trend model estimates President Bush lost -.0309% approval per day, or one percent every 32.4 days. From November through January, he reversed this decline, gaining +.0362% per day, or a point every 27.6 days. However, since the State of the Union address, his decline has been -.0720% per day, or one percent each 13.9 days. That is a devastating rate of decline, which would put the President's approval at 20.4% on election day 2006, below the all time low of 22% for President Truman. On the other hand, if the White House could duplicate the positive momentum they sustained from November 11 through January, the president could gain 6.8% by election day, for 40.8% approval on November 7.
Given that the current rate of decline is the most rapid of the Bush presidency, it seems unlikely to be sustained throughout the rest of the year. Still, even if the rate for the rest of the 189 days until the election returns to the rate of most of 2005, the model would predict approval of only 28% on election day. A sustained rally of the "base", coupled with continued decline among independents, would produce approval of 30-33%. In other words, only a significant reversal of fortune, such as in November-January, seems likely to produce an election day approval near 40%.
Gallup and CBS report somewhat different results by party identification. Gallup finds Republican support at 81%, Independents at 21% and Democrats at 6%. Those are new lows for Independents and Democrats but an upturn in support among Republicans, whose suport had been 74% and 78% in two earlier April surveys. Thus the decline from 36% to 34% in the Gallup results are due to still further decline among Democrats (from 11 to 6%) and Independents (from 26% to 21%).
CBS arrives at almost the same overall approval (33% vs 34%) with lower Republican support but higher Independent approval. CBS finds 68% approval among Republicans, down from 77% on 4/6-9, and 32% approval among independents, UP from 24% in the earlier survey. Democratic support fell from 12% to 6%.
It is hard to understand the apparent rise in Independent approval at a time when overall approval continues down. Even if we go back to the CBS poll of 3/9-12/06 which registered a 34% overall approval, we still see an improvement in approval among independents from 28% in March to the current 32%. (Accompanied by a drop in Republican approval from 74% to 68%, while Dems held steady at 6% in both polls).
The Gallup and CBS party id questions differ (see my earlier post here on house effects on party id). Both get 35% Dem, but CBS has Reps at 27% vs Gallup's 30% and Independents at 37% vs Gallup's 34%. If we make the (rather bold) assumption that the difference is due to question wording that leads CBS to classify about 3% as independents who Gallup's question would put into "Republican", then this would have the effect of raising Bush support among CBS Independents, which we see. However, you'd also expect it to raise the loyalty rate of the remaining 27% CBS Republicans, which is not what we see.
An alternative would be that CBS's question stresses "Generally speaking, do you usually think of yourself as a Republican, Democrat..." while Gallup stresses "In politics, as of today,...". Those who, "as of today" are still Republican's might be more loyal supporters of the president, while indpendents would include people who "as of today" no longer feel Republican because of poor performance. That would square with Gallups higher Rep. support and lower Ind. support.
For CBS, the story would have to be that the long-term Republicans ("generally speaking...usually think of yourself as...") would include more who are unhappy with the president's performance but remain "generally" Republican, hence producing a lower rating with that group. The higher rating among independents would then have to be because they don't include as many disaffected Reps who have become short term independents. That sort of works but is still hard to square with the higher number of Independents in CBS compared to Gallup.
Also note that with subgroups of this size the margin of error is relatively huge: +/- 6 or 7% for each partisan group. Still, the movement of CBS independents is a puzzle. (Yes, you can make up a post hoc explanation, but for independent support to move up when both Reps AND Dems move down is not what we'd expect to generally occur.)
Bottom line: the trend continues to be bad for the White House and for Congressional Republicans. Unless the rate of decline is arrested soon, presidential approval at the mid-term election will be by far the worst in post-World War II history. (I'm preparing a separate post on approval at midterm. I'll link here when it is ready.--It is up now. Click here.)
Click here to go to Table of Contents