Showing posts with label lieberman. Show all posts

Wednesday, August 09, 2006

CT Sen: Exit poll results


The CBS/New York Times exit poll data for the CT primary are now available (thanks to Mystery Pollster for the link. The CBS/NYT release is here. Be sure to also see Mystery Pollster's discussion of this and related issues here.)

I warned in the previous posts that aggregate "ecological" data have their pitfalls. Here we get a chance to compare some results from there with results from the individual level relationships available in the exit poll.

The aggregate data showed a substantial relationship between social status and vote. The figure above shows that if we use education as a measure fo socio-economic status we find a substantial individual level relationship. As education rises, Lamont vote does as well, from 39% among those with high school or less to 55% among college grads.

When we switch to individual level income, the effect is surprisingly small. Those making under $50k supported Lamont at a 48% rate, while those over $100k voted for him 52% of the time. That's not much difference, especially given the aggregate data I looked at earlier that found about a 12 point gap between the wealthiest and poorest towns. My interpretation is that context matters quite a bit, while individuals vary a lot across contexts. Well off people live in both high and low income areas, but they voted more for Lamont if they lived with lots of others with high incomes. The exit poll doesn't consider the context, so the income effect is quite modest at the individual level.


There are other ways to interpret differences between aggregate and individual level patterns of income effects. A recent terrific paper by Andew Gelman, Boris Shor, Joseph Bafumi and David Park is here, with some blog discussion and a powerpoint version here. This is not for the weak, but does a great job explaining income effects on Dem vs Rep voting. It incidentally finds that individual level income effects are weakest in Connecticut. That wouldn't necessarily carry over into a partisan primary, but it is an interesting point.

My conclusion is that the individual data continue to support the conclusion that Lamont did best with higher socio-economic status individuals.


A second point of individual vs aggregate difference concerns race. In the CBS/NYT exit polls, African-Americans actually voted for Lamont at higher rates than did whites (see the figure below). In contrast, the aggregate analysis found that as the percent black increased from zero to about 3 percent, the Lieberman vote increased substantially, from about 38% to 50%. But this is a clear illustration that the aggregate effect CANNOT be accounted for by purely individual differences. At no more than 3% of the population in these towns, blacks could not possibly account for a 12 point shift in the vote. Rather what we saw with the aggregate pattern was that there were sharp differences in vote between towns that were the most homogeneously white and those with a bit of diversity (while remaining very largely white.) Context matters a lot for behavior in this case, and the small percentage of blacks is an indicator of that context, not of individual differences in vote choice.


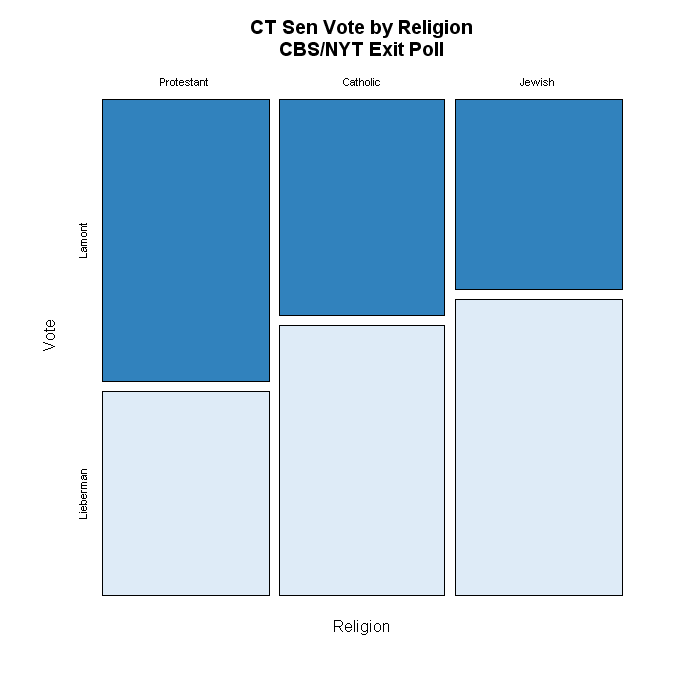
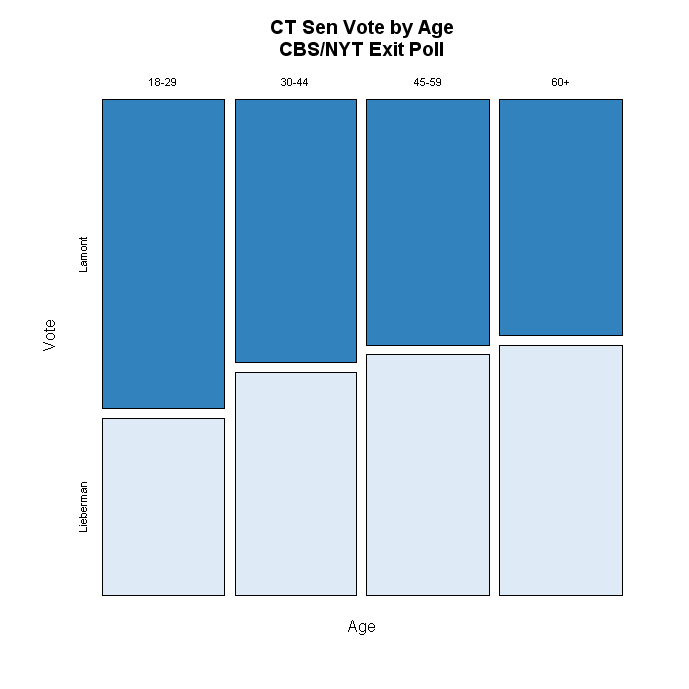
Two other variables have substantial effects on vote, but I don't have much to say about them: religion and age. Both go in the perfectly reasonable expected directions and neither seems to offer a revelation, at least to me.


The effect of ideology is likewise not at all surprising, but here the CBS/NYT exit poll does provide us with the best first hand evidence of how voters shook themselves out in the end. Unfortunately, the CBS/NYT release doesn't tell me how many voters are in each of the ideology groups, so the bars are all equal width (as above also) which is too bad. Widths proportional to population would be a better picture of how important each group was, as well as how different. Since moderates and conservatives behaved about the same, that isn't crucial for the interpretation. What mattered a lot for Lieberman is that in the end he was only able to hold on to the votes of only 59% of the moderates, losing 39% (the rest are missing in the exit poll tables.) But perhaps surprisingly, Lamont won only a slightly greater 62% of the liberals' votes. Liberals and conservatives split on the vote, but both groups have substantial minorities that went the other way.


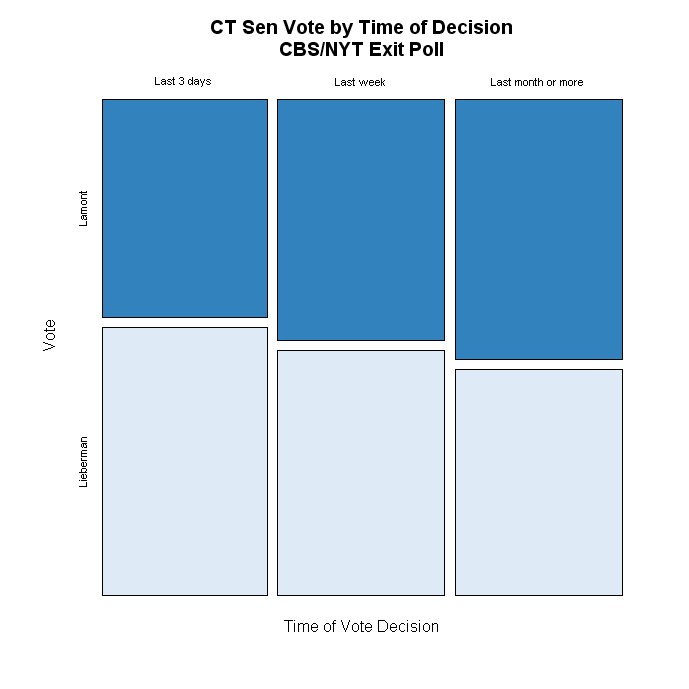
Finally, the time of the vote decision is an indicator of campaign dynamics. We saw polls range from +13 to +10 to +6 for Lamont, suggesting a return to Lieberman was under way. The data here suggest that at least those who waited until the end to make up their mind did in fact give more support to Lieberman. Lamont got 44% of the last minute deciders, to Lieberman's 54%, while Lamont won 53-46 among those who decided a month or more before the election. (The flaw with this is that it may have more to do with the characteristics of late deciders, for example their interest and involvement in politics, than with the dynamics of the campaign per se.)


This has been fun, but I hope this is the last I have to say on the CT Primary for a while!


Click here to go to Table of Contents

CT Sen: Where'd you come from, How'd you vote?


Read the names of the Connecticut towns and you'd certainly think you were in England. Avon, Bridgewater, Bristol, Colchester, Essex, New Britain, New London. That ancestry had quite a role to play in Lamont's victory over Lieberman last night. The plot above shows the Lieberman vote share by the percent identifying their ancestry as "English". All data are at the town level, and the votes are based on complete returns as reported in the Courant.

An important caveat here. These are "ecological" relationships, meaning we are looking at how the vote varies by the concentration of groups within towns. This does NOT mean that individual members of those groups voted for one candidate. It is empirically possible, and is not infrequently the case, that these relationships can be misleading. For example, it is possible that Lamont did well in "English" areas, yet in those areas got no votes at all from "English" individuals. So DO BE CAREFUL in concluding that these relationships hold at the individual level. They may not. Think instead of these relationships as reflecting the relationship between the makeup of places and their votes, not necessarily the votes of specific ethnic or nationality groups. To assess the latter, we would have to have individual level data (or use estimation techniques that are beyond my willingness to work that hard right now!).

Between the least English and most English areas is a gap of some 25 percentage points in favor of Lamont, one of the strongest effects I've found. Further this effect is fairly close to linear above 7% English. I showed here that Lamont did best in the most white towns, but here the evidence is clear that that support was also concentrated by family origin.

The second strongest gradient is among areas with high concentrations of German ancestry, as seen below. Here the total effect is not as great, but still covers a range of some 15 percentage points with Lieberman doing best (about 53%) in the least German areas, and Lamont best (about 60% or above) in areas with the most people of German descent.


The Irish areas (see below) were also somewhat drawn to Lamont, though the Hotline on Call notes some areas that are exceptions to this. The gradient here is only a little less than the German one, about 12 points from least to most Irish concentration.


Lieberman gained strength in areas with high concentrations of Italian and Polish descendants.


As Italian concentration goes from 15% to 30% Lieberman gains about 12 points of support. Beyond that the line continues to rise, but that is driven by few data points so let's be cautious about those few areas.

There are fewer Poles, but the effect is about the same, and a bit more regular. From about 6% to 20% Polish Lieberman gains about 12 points as well.


There are somewhat smaller gains for Lieberman in areas with high French or French canadian populations. While fairly clear, the gains are less than 10 points across a range of concentration.


Ancestry plays a complex role in American electoral alignments. While not the primary structuring mechanism, long held attachments help structure political conflict and attitudes in ways that continue to resonate long after immigrant populations have settled. In this election we see those old ties still having their way with the structure of political choices.

I've also discussed the effects of socio-economic status and race in another post here.


Click here to go to Table of Contents

CT Sen: Results by SES and Race


The effects on vote of socio-economic status in the Connecticut primary are clear, though perhaps not as powerful as the chatter would suggest. (UPDATE: I've added a post using the CBS/NYT exit poll to look at individual relationships to the vote here. There is also discussion of the differences between aggregate and individual level relationships there and here.)

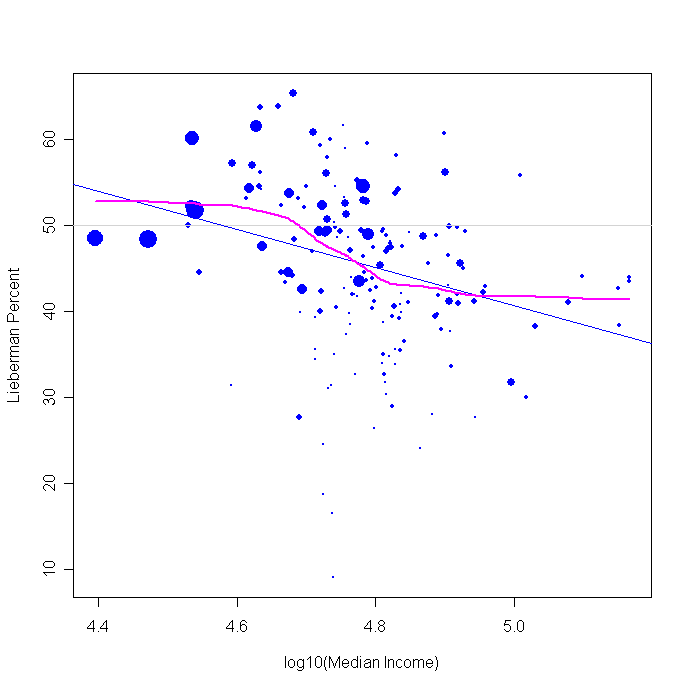
The figure above plots Lieberman vote against median household income (all data are for towns, and these are incomes from the 2000 census.) The log of income makes the relationship a little more clear than simple dollars. The relationship is a bit more linear when using log income than raw dollars. A value of 4.4 corresponds to $25,100, 4.6 to $39,800, 4.8 to $63,000 and 5.0 to $100,000.

The linear fit implies that Lamont gained about 20% more of the vote between the poorest to the richest towns, from about 45% to about 65% of the vote.

The nonlinear fit says this gain was a bit less. Below about $40,000 there was no further gain for Lieberman (or loss for Lamont). And above $63,000 there was little further Lamont gain. The action is primarily in this $40k-$63k range, in which Lieberman loses about 12%-13% to Lamont.

I think the non-linear fit is more revealing throughout these graphs, so the rest of my comments about the effects of these variables are referring to the purple local (non-linear) regression. As you can see, the effects depart quite a bit from the blue linear fits.

So the Volvo driving, latte loving Lamont voters I've been reading about is partly true. Lamont clearly does better in higher income areas. But let's not exaggerate the effect too much. Lamont got about 58% of the vote above $63k in income, which was a considerable advantage. Lieberman did just a little better than break even, winning about 52%-53% among those in towns below $40k. In between things changed rapidly with income.

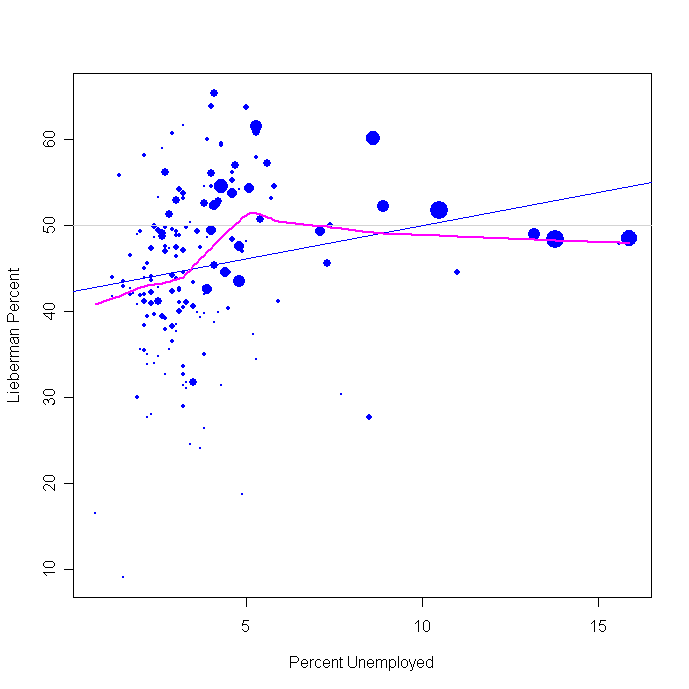
Areas with increasing unemployment also helped Lieberman, but again within a narrow range.


Between about 3 and 5% unemployment, Lieberman gets a fast rise in vote, but his support actually trails off as we get into the towns with the highest unemployment. The differential turnout I discussed earlier here may also account for some of this flattening. Clearly the more distressed areas were not bastions of strength for Lieberman.

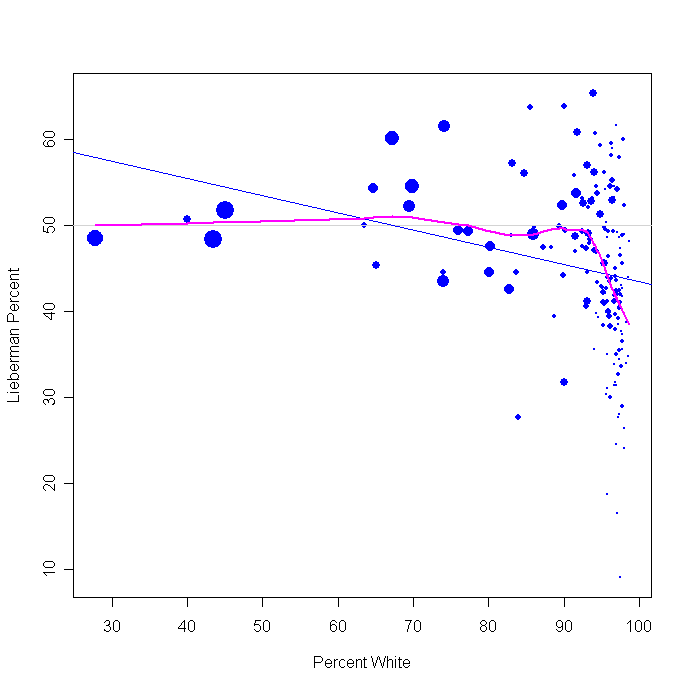
Race had a strikingly non-linear effect. The percent white has virtually no impact on Lieberman or Lamont's votes between 25% to 90% white. Throughout this range the candidates split the vote 50-50. But at white concentration above 90%, the Lieberman support takes a very sharp dive, with Lamont surging to win over 60% of the vote in the most white towns.


This race effect is largely mirrored if we look at percent black or Hispanic. The sharp non-linearity appears in both cases, though slightly shifted to the right for Hispanics compared to blacks. Once the black population reaches about 3% there are only transient gains for Lieberman.


The size of the Hispanic population shifts the Lieberman vote over a somewhat wider range, with Lieberman vote rising sharply as Hispanic population goes from 2% to 10%, but then falling back to about a 50% share of the vote for all ranges of Hispanic population above about 15%.


The bottom line is that Lamont did best in the extremely white areas and with household incomes over $63k. Lieberman managed to do relatively better (but only breaking even or a few points better than that) among the areas below $40k and with less than 90% white populations. The strong effects on vote were concentrated in towns between $40k and $63k incomes and between 90% and 100% white. Outside these ranges, there were very modest further effects of income or race.

I look at ancestry and vote in another post here.


Click here to go to Table of Contents

CT Sen: Got to GOTV


Updated with Complete Returns 8/9 @ 13:00 CDT. See bottom of post for final comments here and links to related posts.

Sen. Joseph Lieberman lost last night to Ned Lamont in a primary that will be a prime example of the limits of incumbency for years to come. With 99.6% of precincts reporting, the AP has the results as 51.78% for Lamont, 48.22% for Lieberman. That margin is a good bit closer than the 6-13% in the late polling.

Some of the late commentary on this race concerned turnout and the Lieberman decision to cut back on get out the vote (GOTV) efforts. As I said here on Monday
The press and political blogs have reported that Lieberman's get out the vote (GOTV) effort has been cut back. If so, the inability to exploit this possible "return to the fold" among moderates may haunt Lieberman Tuesday night. Two weeks ago nothing seemed to be going his way in the polls. Now when there is a small glimmer of hope, the campaign may no longer be prepared to exploit that.
So let's take a look at turnout and how it affected the vote.

All data are now complete, no thanks to the SoS's office. The Courant has complete vote returns. So ignore the rest of this pragraph.
[First a note
: the CT Secretary of State's office is slow to update their data. AP in reporting over 99% of precincts reporting, but the SoS's office is showing only about 70% of towns reporting. I'm using data on 119 of the 169 towns in the state. I'll update this tomrrow when, one hopes, the full data are available. I'll hope the rest of the data don't contradict what I say here, but do take these results as preliminary pending the full report of the data. UPDATED 8/9@09:45 Now with 127 Towns but still only 76% of total votes. Still waiting on the CT SoS office to finish entering their data! See update at the bottom of this post for more details. ALL GRAPHS HAVE BEEN UPDATED].

My story comes in three parts.

First, the figure above shows that Lieberman did better in the larger towns and cities, and Lamont did best in smaller places.

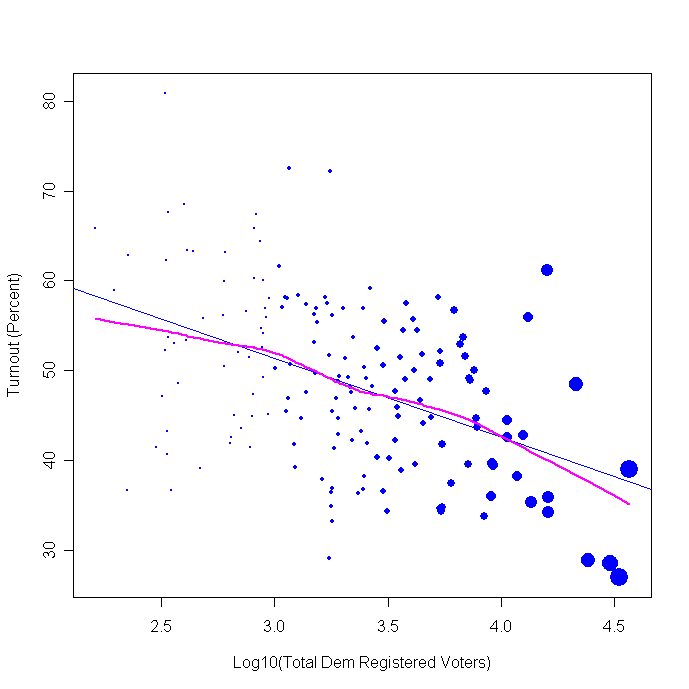
In the figure the number of active registered Democrats is the horizontal axis. I've taken the log of this, so each unit represents a 10 fold increase over the one before it. For example, 3 is 1000, 4 is 10,000 and 4.5 is 31,600 registered and active Democrats. The dots are also scaled so their size is proportional to the number of Democratic registrants. (And another footnote, the SoS does not have uptodate registration figures so I'm using November 2005 data. Given the substantial new registrations from this summer, there will be some inevitable error in these data. However, the relative sizes should be about the same (that is, big towns are still bigger than small ones, even after the influx of new registrations.))

The straight blue line is a linear regression relationship between size and Lieberman vote. The purple line is a local, non-linear, fit between size and vote. The difference between these lines shows how much the data depart from a linear relationship. Not too much in this case.

While Lieberman did better in larger places than small, Lamont did well enough in the larger towns to not fall too far behind due to that, and he dominated the many smaller towns.


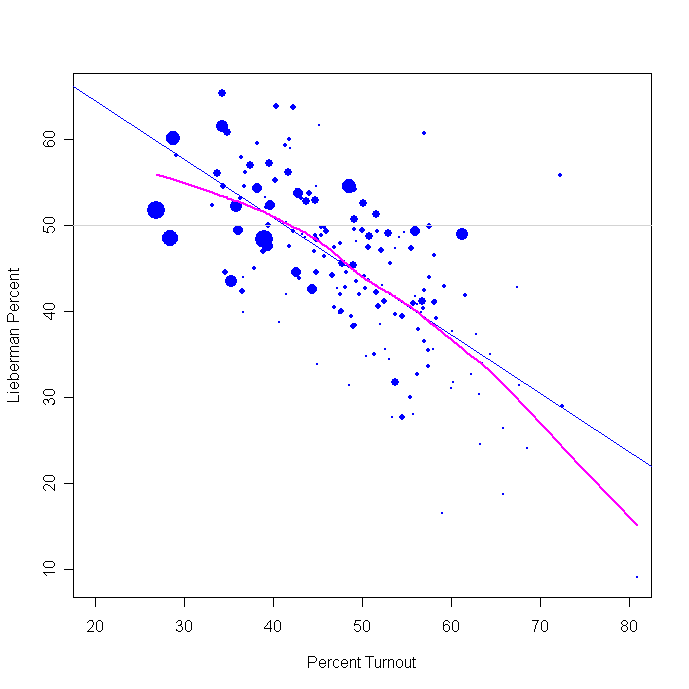
The figure above shows that the largest places had turnouts well below 50%, and often below 40%. Most smaller places had turnouts above 40% and many above 50%. This also means that where Lieberman was strongest, the turnout was lower. An effective GOTV program that raised the turnout in these larger towns would be doubly advantageous: raising turnout in populous areas raises the NUMBER of votes to a satisfying degree, and the populous areas were Lieberman's strength, so mobilization there would have brought in new voters with higher than average support for the incumbent.


Where voters were most energized, they turned out in high proportions for Ned Lamont. Where they reluctantly went to the polls, Lieberman was the beneficiary. Lamont's problem here is getting a high percentage of high turnout but in small places. That may not add up to a large number of votes. Lieberman has the opposite problem: high percentage of votes in big places but where turnout was quite low. The obvious strategy would have seemed to be to maximize that turnout, and reap the benefit. As the closeness of the final tally shows, this race was within reach for Joe Lieberman. Whether a stronger GOTV effort could have found the needed 10,000 votes (3.5% of the total turnout) is hard to answer. A stronger campaign that held a few more former supporters combined with mobilization of the larger towns might well have done so.

UPDATE (8/9/06@ 09:45):

The Ct. SoS office is still slowly updating their town-level vote reports. I've updated all the figures but there are still 42 towns not reported (and 127 which have.) The totals here now represent 76% of the total vote the AP is reporting. You know, it is annoying that state officials are routinely unable to compile complete returns in a timely manner. We have these remarkable machines called computers and high speed networks, but the AP is still faster using the telephone.

One important issue that has been talked about that I didn't get to posting about in the early morning is the "donut" vote. Hotline on Call puts it this way:
Where The Lattes Reign

If there was a way to obtain the per capita income and racial demographics of each Connecticut town, some politico cartographer wizard out there could have a field day portraying the economics and ethnicity of this race. Ned Lamont, scion of the Eastern Establishment, rolled up staggering margins in those places most likely to include his fellow anti-war WASPs. Joe Lieberman, son of a Stamford liquor store owner, won the workaday towns most likely to include other ethnic voters less motivated by opposition to Iraq.

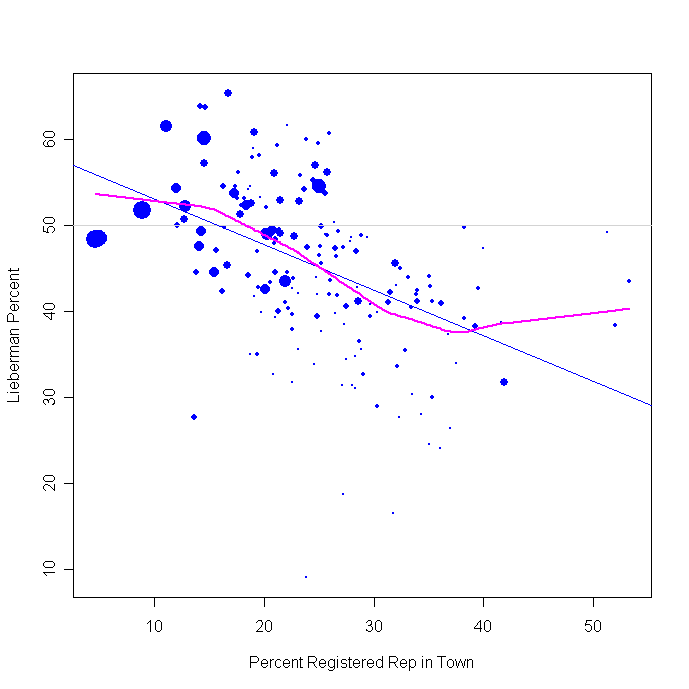
I don't have the economic data handy (at the moment!) but one way to look at this is by the partisanship of the towns. If Hotline and others are right, we should see Lamont do well in areas that have a high concentration of Republicans while Lieberman does well where there are few Republicans. NOTE that this doesn't mean Republicans or conservatives voted for Lamont! It means that in the upper-income and education areas where Republicans are more common, the DEMOCRATS who share their socio-economic status (but NOT their political views) were heavy Lamont supporters, while in the low-socio-economic status towns where Republicans are rare, the Democrats were more likely to support Lieberman.

The graph below tells the tale:


As Republican strength (measured as the percent of registered voters who are Republican) goes up, the Lieberman vote goes down and Lamont goes up.

The class lines reflected in the voting pattern are interesting, if not surprising. They also point to the division in the Democratic party between the highly educated and well paid compared to the traditional working class base. The latter often don't share the ideology of the former. That division has been the party's weakness since at least 1972. (Or arguably 1968; remember Chicago.) Republican divisions are also showing up, though perhaps less often. Last night's results in Michigan's 7th congressional district are an interesting example. (Moderate Republican incumbent Joe Schwarz lost to conservative primary challenger Tim Walberg. I hope to have more to say about that in a separate post.)

Update 8/9 @ 10:47:

I don't want to diminish at all the remarkable success of the Lamont supporters in both turnout and in conversion of votes to their guy. I've written above mostly from the perspective of the failures of the Lieberman campaign, but don't mean to take anything at all away from Lamont and his successes. They are the flip side of each of the graphs above.

More updates as data come in.

FINAL Update 8/9 @ 13:00 CDT:

The complete returns did not alter the story line above, thank goodness.

I've followed up on the class and ethnicity effects in separate posts:

I used percent Republican registration as a proxy for socio-economic status. That is addressed directly in this new post.

I also looked at ancestry here, showing that the old patterns are still in play for the most part.


Click here to go to Table of Contents

Monday, August 07, 2006

CT Sen: Final polls show Lamont by 6 and 10


Two final polls in Connecticut show the primary tightening a bit but with Lamont leading by 6 points (slightly within the margin of error for the difference, which is 6.9%) in a Quinnipiac poll taken 7/31-8/06, and Lamont leading by 10 points (outside the MOE for the difference, 7.8%) in a Research 2000 poll taken 8/1-3/06.

Some news outlets are excited over the shift in the margin from +13 to +6 for Lamont between the Quinnipiac polls taken 7/25-31 and the one done 7/31-8/6. One offers an interesting explanation for the shift "The why is fairly simple: Lieberman had a fairly good weekend of news coverage". He may have had a good weekend, but since most of the poll was completed BEFORE the weekend it isn't an entirely convincing explanation for the change in the poll!

MysteryPollster Mark Blumenthal has a very nice post on the CT polls here. See his take on these and other issues.

Nor is the shift as statistically exciting as it first appears. Lieberman gained 4 points while Lamont lost 3. But since 95 or 96 percent have a preference, what one gains the other almost exactly has to lose. That makes comparison of the margins look like bigger changes than they actually are. The two Quinnipiac polls are of 890 and 784 likely Dem primary voters. The margin of error for the CHANGE between these two polls for Lieberman is 4.75% and for Lamont it is 4.79%. Neither shifted by that much, so statistically speaking we aren't justified in concluding there was a turn towards Lieberman. (You can also calculate the MOE for the change in the margin between the two, which shifted from +13 to +6, a change of -7. The MOE for this change of margins, however, is 9.34%, so that isn't statistically significant either.) The Quinnipiac news release is notably silent on the statistical significance of the changes it reports, and not surprisingly journalists haven't grabbed their calculators before writing about the results.

But that said, remember that polls rarely change by statistically significant amounts over a period of just a week or so. (This is a controversial statement among the brotherhood of campaign consultants and pollsters who will swear that such statistically significant changes do take place. I won't say never, but I will offer evidence that such large change is rare.) This doesn't mean that real trends are not shifting, just that the polls are too blunt an instrument to detect such shifts in trends without a number of polls or extraordinarily large sample sizes. So we are left to informed speculation rather than statistical inference.

I'd not be surprised if Lieberman closed the race a bit at the end. Some do think he had a pretty good weekend, and voting against a long time incumbent is not something partisans normally do. It is the perception that Lieberman has betrayed his partisans (first on the war and Bush, then by rushing to establish an independent candidacy-- in effect refusing to cast his lot with those who had put him in office before) that has sapped his support. The first of these presumably has hurt him the most among liberals, but the second has hurt him among the moderates who make up his natural supporters.

If we look at trends by ideology we see how much damage has been done among the moderates (plus the small number of conservative Democratic primary voters-- Quinnipiac doesn't separate moderates from conservatives, but I assume there are very few of the latter.)


Not surprising is the sharp trends in liberal support for Lieberman and Lamont. As the former collapsed the latter surged. The race among liberals switched from a 60-22 Lieberman lead on 4/30 to a 32-65 Lieberman deficit on 8/6. But Liberals make up about 40-something percent in the Quinnipiac polls (among likely Dem primary voters it appears to be between 38% and 50% depending on the poll and with some assumptions in order to calculate this-- the Quinnipiac news releases don't give this detail.)

Lieberman's losses among his core supporters, the moderates, are less extreme but politically devastating. From a 67-18 lead 4/30 he dropped to a thin 49-45 margin 7/31, and has recovered a bit in the 8/6 poll to 53-43. (Note that what I said above about the lack of statistical significance of the changes applies even more so here. These shifts are great fun to look at and speculate about and interpret, just as I am about to do!, but they aren't distinguishable from random noise in the samples.) It may be that moderate Dems will have a hard time bringing themselves to vote against Lieberman and for Lamont, and so here at the end we'll see some upturn in support. It seems quite unlikely that the same dynamic would affect liberals, who have cut their ties to Lieberman by 2-1.

The press and political blogs have reported that Lieberman's get out the vote (GOTV) effort has been cut back. If so, the inability to exploit this possible "return to the fold" among moderates may haunt Lieberman Tuesday night. Two weeks ago nothing seemed to be going his way in the polls. Now when there is a small glimmer of hope, the campaign may no longer be prepared to exploit that.

And for a final word on the fallibility of polling. Above I pointed out that these polls have a margin of error of 3-4% on the percentages for each candidate, but that the MOE on the DIFFERENCE between Lamont and Lieberman (+6%) in the final Quinnipiac poll is actually about 6.8%. That is based on sampling theory alone. Add in uncertainty in correctly identifying likely primary voters, plus the usual response error, and the race is certainly close enough that we should not bet the entire farm on the polling. The consistency of recent results across the last 4 polls certainly increases our confidence that Lamont is ahead. But it is easy to overstate that confidence. Likewise the Research2000 poll over the weekend found a +10 Lamont lead, which was outside the MOE of 7.8%. My analysis of several thousand polls since 2000 finds that as predictors of election outcomes, we need to expand the MOE by about 30-50%. So while I believe Lamont is ahead, there is a non-trivial chance that the polls will be wrong-- say about 20% for the Research 2000 poll, and about 28% for the last Quinnipiac poll.


Click here to go to Table of Contents

Thursday, August 03, 2006

CT Sen: Lieberman falls, Lamont Surges


With only five days to go, the Connecticut Senate primary polling points to a continued decline in Sen. Joe Lieberman's support, while Ned Lamont as surged dramatically. Two Quinnipiac polls, one completed August 31 and the other July 18, sampled likely Democratic primary voters. These and earlier Quinnipiac samples point to a steady and sharp decline in Lieberman's standing with voters, and the ineffectiveness of his campaign for renomination by his party. Meanwhile, previously unknown challenger Net Lamont has surged from under 20% of the vote in February to 54% in the latest survey compared to 41% for Lieberman.

There are important caveat's about the difficulty of sampling likely primary voters in Connecticut. See MysteryPollster's excellent analysis of that here. In the graph, it is also important to note the change from a registered Democratic sample prior to June and to a sample of likely Democratic primary voters since then. This change is responsible for some (but not all) of the apparent decline in Lieberman support and Lamont's rise. But focusing on only the three polls since June, the trends are clear.

Perhaps the single most disturbing result (from Lieberman's perspective) from the latest Quinnipiac survey is Lieberman's loss of support among moderate and conservative Democrats in Connecticut. In June (6/6) he held 61% of moderate or conservative Democrats likely to vote in the primary vs 26% for Lamont. In mid-July (7/18) that still held at 59% vs 39%. But in the latest sample (7/31) Lieberman's support among this group has fallen to 49% (vs 45% for Lamont.) If anyone in the Democratic party could save Lieberman, it would be the moderate/conservative Dems who make up a slight majority of the likely primary voters. That earlier advantage in support seems to have now essentially vanished. (Liberals have shifted from 49% to 32% to 31% over this same time in Lieberman support, with Lamont support rising from 41% to 67% to 66%.)

This is a remarkable collapse for Lieberman. While the war issue is the most mentioned reason for opposing him and supporting Lamont, the inability of a veteran Senator to respond to this challenge and rally his campaign supporters is stunning. Next Tuesday we'll find out if the polls were right or not. But regardless, the ineffectual Lieberman campaign is a reminder that incumbents are "safe" only when they have the skill to keep themselves so.


Click here to go to Table of Contents