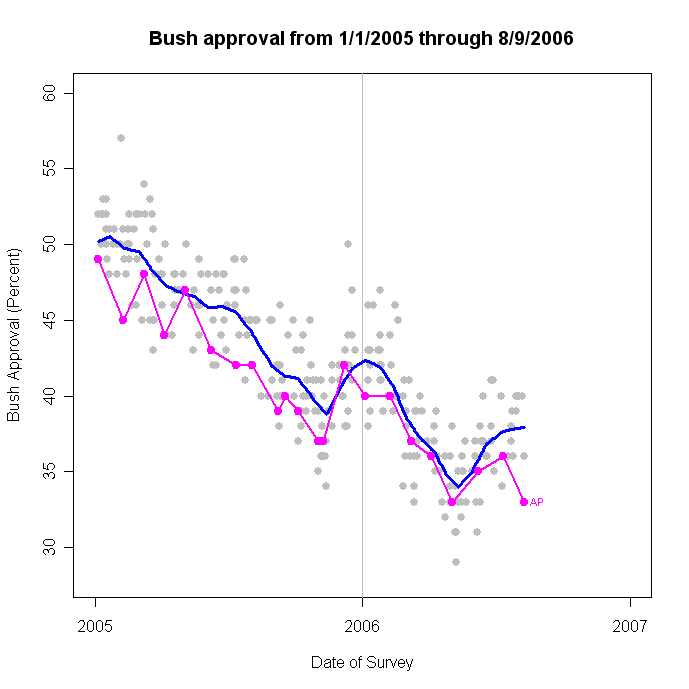
The new AP/Ipsos poll, completed 8/7-9/06 finds President Bush's approval rating plummeting to 33%, a remarkable result when the last 14 polls have remained in the range from 36 to 40. If true, this is a sharp departure from recent trends. The dissapproval rate in the new poll is 64%, a one point increase from July. (Note that RealClearPolitics has the disapproval rate at 57%. This is wrong according to the AP/Ipsos results published on their site, which shows the balance at 33-64. This has now been fixed at RealClear.)
A three point drop is "huge", but not by the standards of statistical inference. The previous AP poll (7/10-12) was at 36%. Both polls are of about 1,000 adults (1000 and 1001 to be precise.) The margin of error for each poll is 3.2%, but the margin of error for the DIFFERENCE between two polls, each of 1,000 respondents is 4.47%. So the three point change between the AP's July and August polls cannot be said to be statistically significant, even if it "seems huge." I've written at length on the problems of detecting change in approval polls (link and link). This case is a prime example of this difficulty when approval changes relatively slowly but polls vary by a good deal more than the expected change. For example, if Bush approval were changing by 1 point per month, then in this example it would take 4.5 months to change enough to show a "statistically significant" difference in the AP poll. Here the polls are just under a month apart so detecting "real change" is difficult.
It is clear from the graph above that the new AP poll is well away from the scatter of other polls around the trend line. Does this mean it is a statistical "outlier"? That is, farther from the trend line than we would reasonably expect given sample size and the variability we see across all polls? Let's see.
The "residuals" are the observed approval rating minus the predicted approval from the dark blue trend line in the figure above. In the time since January 2002, 90% of all polls have had residuals falling between -4.66 and +4.04 of the trend line. (The mean residual is zero.) I start with 2002 because the effects of 9/11 on approval are extreme and exaggerate the size of the residuals.
The 90% confidence interval is the region in which 90% of the polls fall. The "outliers" are the 5% of polls that fall more than -4.66% below the trend and the 5% that fall more than +4.04% above the trend. In the plot below I highlight the outliers in red, and plot the AP/Ipsos polls in orange. Other polls that are not outliers are in gray. The horizontal lines indicate the low and high limits of the 90% confidence region plus the mean residual at zero.

By this standard the latest AP poll is an outlier. It is clearly outside the lower bound of the confidence interval, with a residual of -5.7. (Technical note, this is the residual from the trend estimated WITHOUT including the new AP poll. We want the outlier assessment to be independent of the effect the outlier has on the estimated trend. As of yesterday, before the new AP poll arrived, the estimated approval trend was 38.7%.)
So what do we conclude from this? It is unlikely that we would get a poll this far from the current trend estimate. Further, given movement in the trend over time, it is not plausible that there has been a "real" three point drop in approval. There is great variability from poll to poll, but the trend estimates show that approval changes at a pace of one percentage point every two to four weeks, not by three points in one week, or even in four weeks if we compare the last two AP polls.
It is possible that the AP result signals a sharp break from the past. Given the track record of outliers in these data (over 1100 polls in all) that is not likely. Far more likely is that new polls will confirm that the trend has changed by modest amounts, either up or down, and that the next poll will be closer to 38.7% (both above and below) than to 33%.
This is not to say that the trend cannot change. We have seen three very clear examples of reversals in aproval trend since January 2005: in November 2005, February 2006 and May 2006. At some point approval may again trend down (or more sharply up, for that matter.) But it would not be a statistically good bet that the AP poll is where approval really stands right now.
P.S. There was a great question in the comments, so I'm copying it in here, along with my response, so more people will see it.
Alexis Leon said...
What is the rationale for defining the residuals as (observed approval rate - trend estimate), instead of (observed approval rate - trend estimate - polling company's own house effect)? After all, wouldn't you expect a new AP/Ipsos poll to be a bit below trend already, given that they come with a slightly negative house effect? I suspect that, after taking that into account, the new AP poll could no longer be considered an outlier.
In any case, what is the current estimated approval trend (that is, after including the new AP poll)?
Thanks a lot for the great work you're doing here!
Alexis,
Excellent question!!
We can take out the house effects, but then the residual variance shrinks as well, so what the AP gains from accounting for the house effect it loses to the tighter confidence interval.
Still, it is a really good point, so I re-ran it taking out house effects. The result is that the AP residual after accounting for the house is -3.55 and the lower boundary of the confidence interval is -2.94. So it remains an outlier. (In fact, it is also outside the 95% CI as well, which has a lower bound of -3.44.)
Accounting for house effects does very little to alter the trend estimates, by the way, because the polls are pretty close to symmetric around the mean. But house effects do reduce the residual standard error by quite a bit-- about a 25% reduction.
As for the trend WITH the AP included: it is revised down to 37.95. However, that is misleading because the AP is both extreme and at the end of the series, so it is exerting a strong effect on the trend estimate. With a few more polls, the impact of the outlier will come close to vanishing, and the trend will return to somewhere close to 38.7, depending of course on what the new polls show. Outliers matter for my trend estimator only briefly. Once they are surrounded by other data their effect is much reduced.
Charles
Click here to go to Table of Contents