
A Harris poll taken 8/4-7/06 finds approval at 34% and disapproval at 66%. That is unchanged since the previous Harris reading 7/7-10. With the addition of this poll and the AP "outlier" from 8/7-9, this brings the estimated trend to 37.4%, with a small downward trend. If we exclude the AP, then the trend estimate is 38.0% and the trend is slightly rising. Both estimates include the Harris reading. The plot above includes the AP poll in the trend. I've never excluded a poll from the trend estimate, even if the evidence shows it to be an outlier. Any effect will be diminished with a few more polls.
But this does pose a bit of a question of what's happening to approval. I've maintained that the evidence prior to the Harris and AP polls was that approval was increasing at a very slow rate of about 1 percentage point per month since June 20. With the Harris poll that rate of increase would be decreased, and the inclusion of AP reverses the trend direction, though by a small amount.
First, note that the last four Harris readings have been 29, 33, 34 and 34. That is consistent with what the overall trend has done-- a low point followed by increase followed by either slow or stagnant trend thereafter. Harris's low level of approval is consistent with the Harris house effect, which is the most negative house effect of the 22 polls I track house effects for. Here is an updated table of house effects on approval:
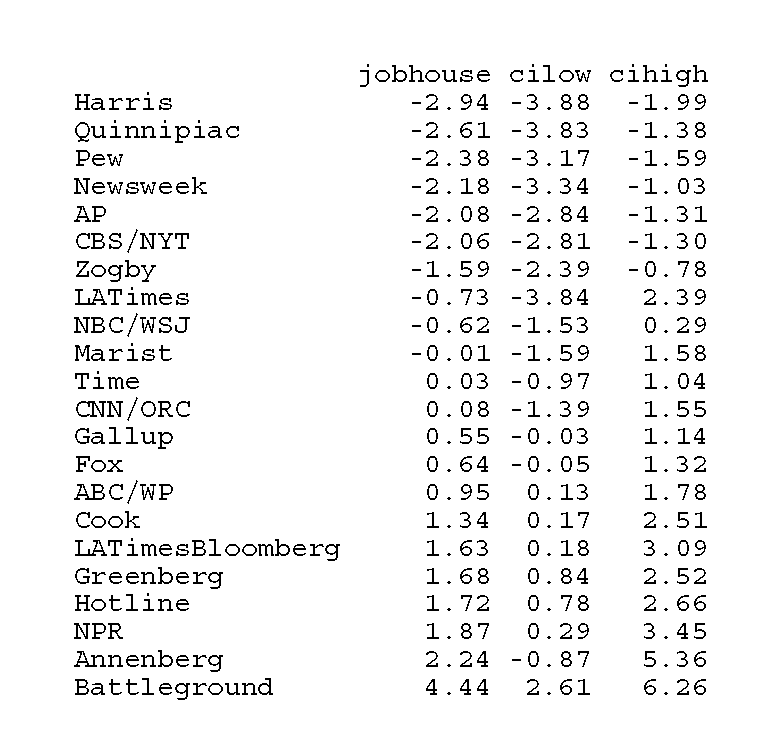
The Harris estimate is -2.94, which is consistent with the purple line in the top figure, showing Harris consistently below the estimated trend. Applied to the current estimate, that would say Harris+2.94 would be about 37%, which is in striking distance of the 38% trend estimate without AP or the 37.4% with AP. So Harris doesn't appear WAY out of line with the trend, given it's large house effect.
Yesterday I showed that the AP reading at 33% IS an outlier. If we add the Harris poll into the data, since it was completed before the AP poll, this conclusion remains unchanged-- even revising the approval trend to include Harris does not stop AP from being outside the 90% confidence interval. However, Harris does not appear to be an outlier regardless of what method is used to test that (either with or without accounting for house effects.)
So I'm left wondering if the small downturn we now see with Harris and AP (and Fox at 36) added to the trend is telling the future or not. Given the three 40% readings in the first week of August, it is not really credible that approval has jumped down to the 33-36 range from the 38% range of the trend estimate before these new polls came in. And Harris and AP do have relatively large and negative house effects (Fox is a modest +0.64), so it isn't surprising they would be below trend.
Lacking a crystal ball, I'll wait for more data. Certainly this week's data have reduced the credibility of rising approval and increased the evidence for a flat period. Whether that will turn into a decline or new rebound or just plain stability is unclear.
Click here to go to Table of Contents