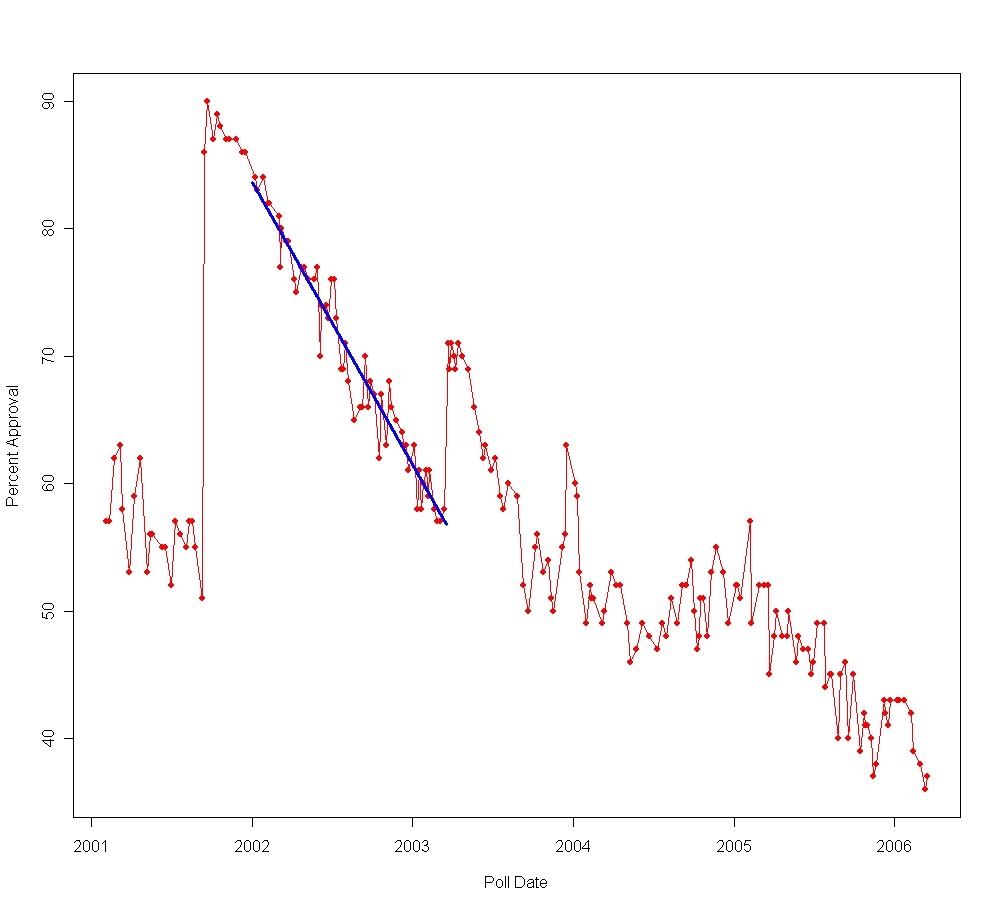
Approval of President Bush, 2001-2006. The blue line is the estimated trend from 1/1/2002 through 3/19/2003. During this period approval declined from 84% to 58%, a rate of 0.061% per day, or one percent every 16.3 days. The downward trend is both statistically significant and undeniable based on visual inspection. Yet of 56 Gallup polls during these 15 months, only 5 (8.9%) found a significant change in opinion from the previous poll. What gives?
Frank Newport, Editor in Chief of the Gallup Poll, wrote last week:
There has been little change in George W. Bush's job approval rating in the last week. The March 13-16 Gallup Poll pegs his approval at 37%. This rating is virtually unchanged from the 36% measured over the March 10-12 weekend, and not statistically different from two February polls prior to that.(Alas, this is now on Gallup's subscription only website so this link will only work for subscribers. To be clear, he argues there was stability in December and January, an abrupt downturn in February, followed by stability in the last 3 or 4 polls. I've taken issue with that part of the argument here. Today we turn to a different topic.)
In general, it's clear that the public's assessment of Bush's job performance has not undergone a dramatic free fall, as some may think. ...
Let's take this paragraph apart for a moment. Newport is comparing one poll from 3/13-16 with one from 3/10-12. That is four days from the end of interviewing for one poll to the end of interviewing for the next. Four days. What should we expect to happen between these two polls? My current estimate of the rate of change in President Bush's approval rating since his State of the Union Speech on January 31, 2006, is -0.131% per day, or one percent each 7.6 days (about twice as fast as in 2002). So how much change would we expect in the 4 days between these two Gallup polls? 4 x -0.131 = -0.52%. The margin of error for the difference between these two polls is +/-4.22%. So it is inconceivable that these two polls could detect the half-a-percent change in approval that the trend since February 1 would predict over these four days, even IF the trend continued unchanged. (See the note at the bottom on calculating margins of error for differences of percentages.)
What about the two previous February polls that Newport mentions? The second poll was 2/28-3/1, 15 days from the end of the most recent Gallup poll. Expected change over this time? 15 x -0.131 = -1.965%. Margin of error for the difference between these two polls? 4.22%. So the expected change is less than half what the margin of error would allow us to detect. Not surprising then if we conclude "no significant change".
For the earlier of the February polls, 2/9-12, the approval rating was 39%. In the 32 days between the end of that poll and the latest in mid-March, we should expect approval to decline by 32 x -0.131 = -4.19%, while the two polls have a margin of error for the change in percent approval of +/-4.25%. Just inside the margin. (The February 6-9 poll was 42%. We'd expect a change of 4.58% between then and March 16. We actually saw a 5% change. The margin of error in this case is 4.28%, so that change IS statistically significant.)
The point here is that when we take polls close together in time it is VERY OFTEN the case that they simply cannot detect the changes taking place in presidential approval! There is loose talk about "free fall", but the fact is that President Bush's approval has clearly declined, but at rates from 1% each 7.6 days (post 2006 State of the Union), to 1% each 16.3 days (during all of 2002 through March 19, 2003), to 1% each 32 days (from January 1 through September 1, 2005). The "free fall" in NOT on the order of 10 points a week or even per month. In fact, it has rarely if ever touched 4% per month. But most polls of 1000 or so respondents cannot reliably detect changes of less than 4.2% or so. That means that polls taken less than a month apart are almost guaranteed to find no significant change. How often are Gallup Polls taken? In the Bush presidency, they average one poll each 9.28 days. So even during the most dramatic downturns in approval of President Bush, we would need to look at Gallup polls spaced at LEAST 3 polls apart, and perhaps much more in order to expect to detect real changes in approval, given realistic estimates of how fast approval changes and the margin of error of the polls.
This simple fact seems to escape many commentators and, as the quote above demonstrates, the Gallup leadership as well.
To put this in a more empirical light, I've looked at a period in which it is hard to question the decline in President Bush's approval ratings: the year 2002 through the start of the Iraq war on March 20, 2003. The graph above puts this period in perspective. The inevitable decline from the huge rally effect of the September 11 terrorist attacks continued throughout 2002 and into early 2003 until the start of the Iraq war produced a new rally for the president's approval numbers.
As the blue line in the graph above makes clear, the decline is very close to linear, and regular throughout this time at -0.06118% per day. I pick this time, rather than the current period, because there are 57 Gallup polls taken over this extended period, and because the trend seems beyond debate. The current downturn in approval may last or it may stabilize (as Gallup's Newport suggests in his item on the latest poll) or it may yet reverse and turn up after the President's new efforts to rally public support. So we'll avoid those issues in order to make the point more clearly using data where the trend seems to be beyond debate.
During the period from 1/1/2002-3/19/2003, Gallup conducted 57 polls, an average of one each 7.68 days. The rate of decline in approval over the entire period would predict a change in approval from one poll to the next of 7.68 x -0.06118 = -0.4699%. Since the margin of error is typically on the order of +/-4.2 to 4.4%, it is clear that consecutive polls are simply unable to detect this amount of change. But what exactly does this mean? Let us see.
During this period, approval of President Bush declined from 84% to 58%. Of the 56 pairs of consecutive polls Gallup conducted, only 5 found a significant change between polls. And the irony is that those five are probably incorrect, simply because the rate of change is too low for ANY of the consecutive polls to detect.
Let's plot the data. In the somewhat complicated plot below, I graph the change in approval from one poll to another during this 2002 and 2003 period. The horizontal gray dash ("-") marks the change in approval from one poll to another. The vertical lines from this dash indicate the 95% confidence interval around the observed change, what is commonly called the "margin of error". In the middle of the graph is a horizontal line at zero, indicating no change from poll to poll. If the confidence interval crosses this line, then we do NOT have a statistically significant difference between the two polls. If it FAILS to cross zero, then the difference IS statistically significant. To make the significant differences stand out, I've colored them red, and the non-signficant differences I've colored gray.
I then vary the "lag" between polls. A lag of 1 is the difference between a poll and the one immediately preceding it. A lag of 2 is the difference between a poll and the second poll preceeding it, and so on. As the lag increases, so does the time between polls. While they are not spaced exactly equally, the spacing doesn't vary hugely. More to the point, Gallup, reporters, and other polling firms, usually compare their results to their previous poll, so this lag makes sense.
The figure below shows the poll-to-poll changes for lags from 1 to 9, that is from polls immediately adjacent to polls separated by eight other polls. The red confidence intervals indicate statistically significant changes in approval, the gray ones are not statistically significant.

(It will help a lot to click on the figure, then click again to see the maximum resolution of this!)
Start at the top left. When we look at adjacent polls, those lagged only once, we see that the vast majority of changes are not statistically significant. Based on this we could say that approval declined from 84% to 58% yet the Gallup poll almost never (ok, 9% of the time) found a significant change from one poll to the next. As the lag between polls goes up, you can see that more of the confidence intervals indicate a significant change, but only when we get to polls that are lagged 9 (nine!) polls apart do we reach statistical significance even HALF the time. Remember the first graph above. It is undeniable that approval was falling steadily in this period.
How about for larger lags? Here are lags 10-18.

(Click the figure and click again for maximum resolution.)
As the lag increases, the rate at which we can detect differences increases. By lags of 18 we find that virtually all differences have become significant. That's exactly what we should find if approval is continuously declining at the moderate rate we see in this period.
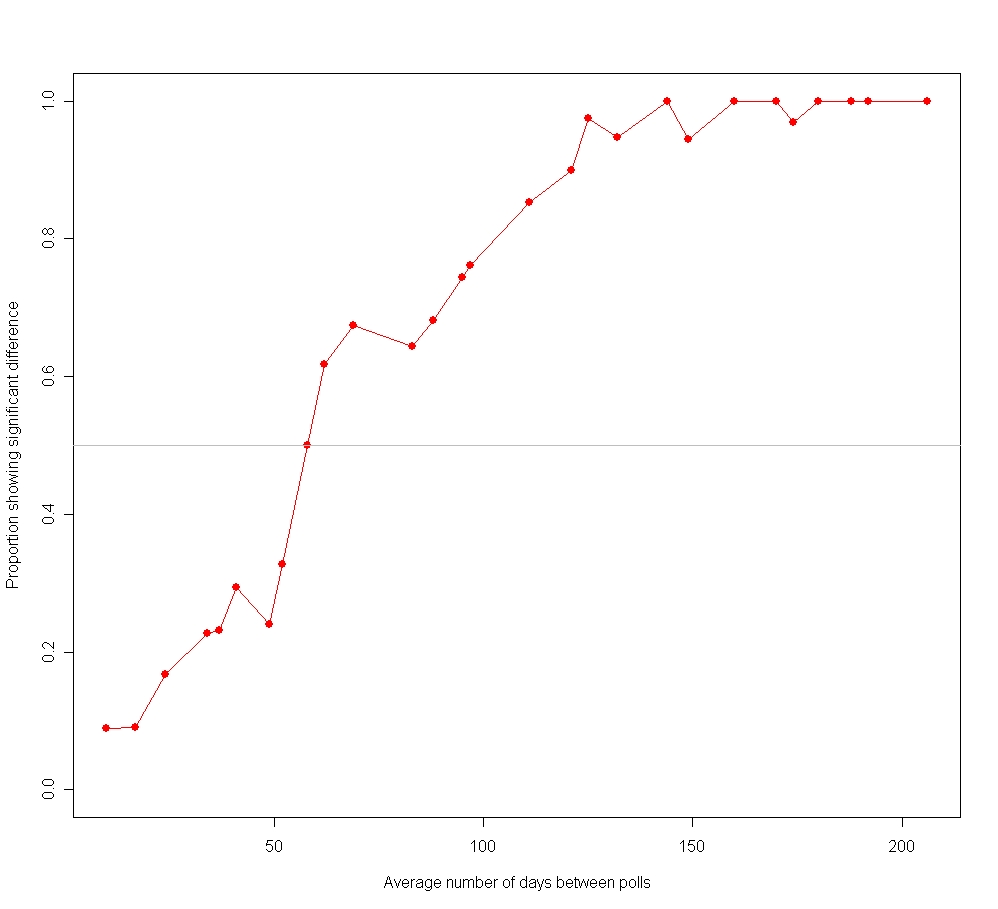
How does the probability that we detect a change vary with the length of time between surveys? Quite nicely, as it happens. The figure below plots the percentage of "significant differences" against the average number of days between the pair of polls. Short times between polls make it very unlikely that a difference is detected. By 58 days between polls, we have a 50-50 chance of detecting significant differences. And over 100 days, we get more than 80% significant differences.
So it isn't that there is anything "wrong" with the Gallup poll. In fact, I think Gallup is one of the very best polling organizations for technical execution and state-of-the-art methodology. But they do a LOT of polling. And the write-ups of their results perhaps forget that lack of statistically significant changes between polls is a function of both the rate of real change and the interval between polls (and sample size, but that is a minor factor here.) This sometimes leads to counfouding a statistical conclusion with a substantive one.
It is important that we compare polls with some fixed point. What is the President's approval rating now, as opposed to right after the State of the Union? (37 now, vs 42% then, and a statistically significant downturn, though not, perhaps, "free fall".) Or compared to the start of the year (43% then, also a statistically significant change.) When we instead compare from one poll to the next, the time interval is too small. Indeed, the Newport quote above that sparked this post compares polls four days apart! For that to produce a statistically significant change the President would have to be falling at a rate over 32% per month!
There is undoubtedly a lot of hype about the President's declining approval rating, and it is all too easy for Democratic partisans to point to each tiny drop with glee. But when we ignore how closely spaced polls are, and then assert the conclusion that there is no "significant decline" we err the opposite way-- reaching a substantive conclusion of stability when the statistical evidence is simply too weak to support any reasonable conclusion.
See also. I've written about this topic before, but not quite from this perspective. See that post here.
Calculations. The confidence interval (or margin of error) the the difference of proportions for two independent surveys is approximately:
(p2-p1) +/- 1.96 x sqrt(p1*(1-p1)/n1 + p2*(1-p2)/n2)
where p1 and p2 are the percentages (or proportions) in surveys 1 and 2, and n1 and n2 are the sample sizes of the surveys. (This is the formula for a simple random sample. Telephone polls may use stratified sampling which modestly improves efficiency (reduces the margin of error) but these effects are relatively small, so the above estimates are reasonable. The margin of error reported in news accounts is almost always based on simple random sampling.) Gallup surveys are usually around 1,000 respondents (the mean of the polls here is 998.) Bush approval averaged 69.46% during the period 1/1/2002-3/19/2003, but varied from 84% to 58%.
Click here to go to Table of Contents