Updated with polls through 8/9/06 See bottom of the post for the latest estimates and confidence intervals. The graph above is also updated through the latest polls.
I've often posted on "house effects", the tendency of polling organizations to systematically vary in their results from one another. It seems time to consolodate that information into a single post, rather than as part of a post on something else. So here is a post that will become the standard spot for current estimates of house effects.
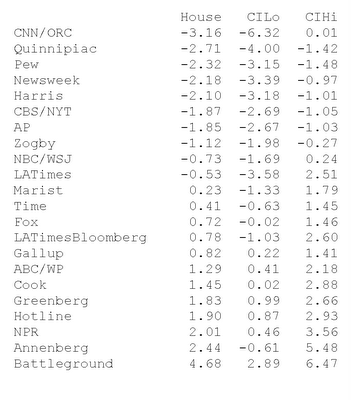
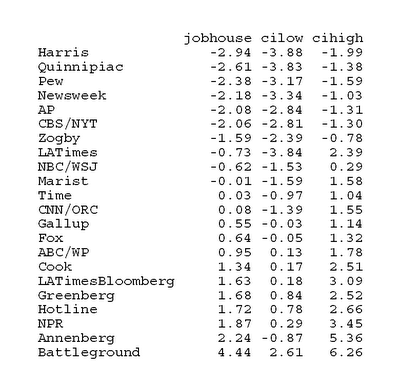
The graph above plots the house effects for presidential approval for all pollsters in 2005-2006.
The house effects measure how far polls by a firm are from what would be predicted based on trends over time for the average firm. In other words, the average house effect is set to zero by design. A poll that is consistently 2% below what would be predicted for the date the poll was conducted will have a house effect of -2.0%. This model accounts for trends in presidential approval over time and for events, such as Katrina, that shock approval up or down.
The confidence interval in the plot represents the margin of error for the estimated house effect. That margin is wider for organizations that do fewer polls and also reflects variability in results for the house. The very wide margins for CNN/ORC, LATimes and Annenberg are due to those polls conducting only a single poll during the 2005-06 period. CNN/ORC in particular will shrink the confidence interval as more polls accumulate. LATimes has now partnered with Bloomberg so I'm developing estimates of their house effects separately from the old LATimes estimate.
These estimates are specific to the presidential approval question as posed by each organization. We would get different house effects for different questions, such as party identification. I may add house effects estimates for some of those other items later.
House effects are usually pretty stable over time, but I'll update this as more polls accumulate.
Here are the estimated house effects as of polling completed by 4/23/06. (Note that since CNN/ORC only have one poll, the confidence interval is very wide and the estimate below will certainly change with more data.)
CNN/ORC -2.92
Quinnipiac -2.72
Pew -2.32
Newsweek -2.19
Harris -2.09
CBS/NYT -1.88
AP -1.86
Zogby -1.14
NBC/WSJ -0.90
LATimes -0.55
Marist 0.20
Time 0.42
Fox 0.72
Gallup 0.81
LATimesBloomberg 0.84
ABC/WP 1.30
Cook 1.48
Greenberg 1.82
Hotline 1.89
NPR 2.01
Annenberg 2.42
Battleground 4.65
For another look at house effects see the superb graphs and discussion by Robert Chung here and also here.
UPDATE 4/27/06: Here are the current estimates with confidence intervals, for polls completed through 4/24/06. There is a small shift for NBC/WSJ due to its new poll. That estimates shifts from -.90 to -.73. Note that these are 90% confidence intervals.

Update: 8/12/2006: I've updated the estimates of house effects to reflect new polling in 2006. The table of new estimates and the confidence intervals appears below.

Click here to go to Table of Contents