 Go to this link for a more recent update of the Wisconsin Governor's race polling. 7/20.UPDATED 7/11 with new UW/Badger Poll data. See update at the bottom of the post.
Here in Wisconsin we have a barnburner of a tight Governor's race. Or, the race is close enough to be interesting but not neck-and-neck. Or the incumbent is well ahead. Which is it? Depends almost entirely on which pollster you read.
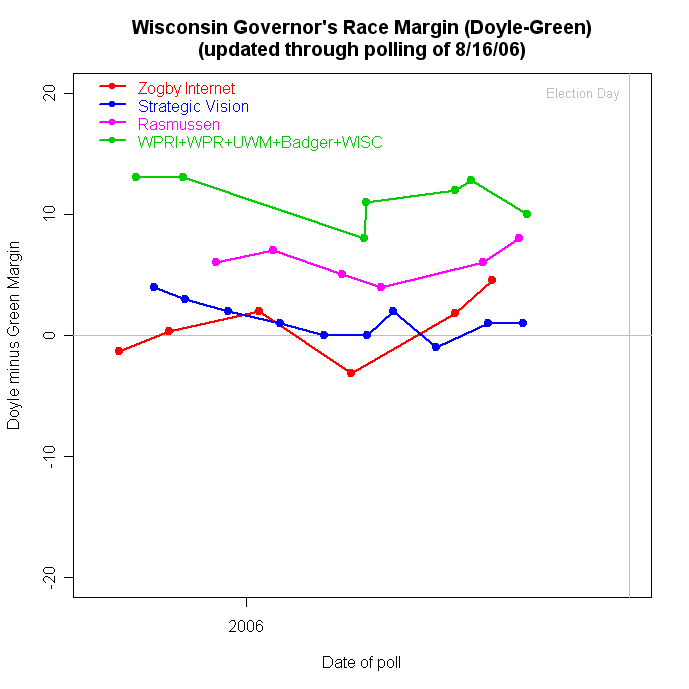
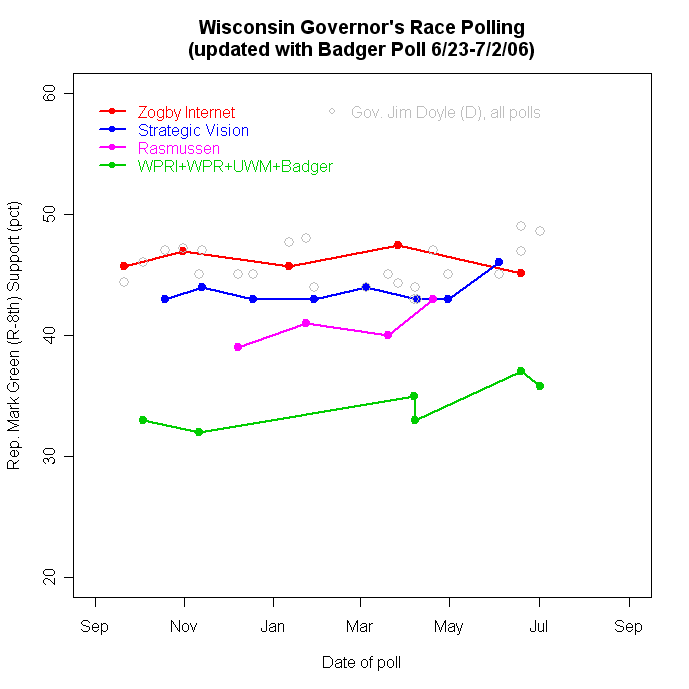
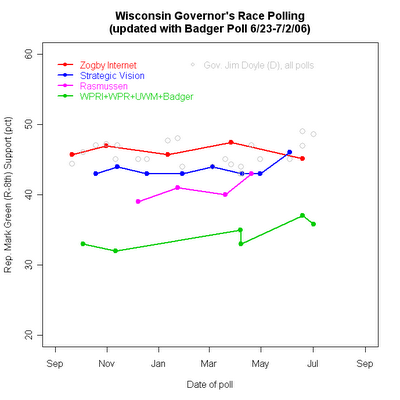
The graph above shows the polling since Sepember 2005. The Wall Street Journal/Zogby Interactive poll shows it nip and tuck. Zogby averages 46.10%-46.16%, with challenger Rep. Mark Green (R) ahead by 0.06% over incumbent Gov. Jim Doyle (D). That's inside the margin of error, by the way.
Georgia polling firm Strategic Vision sees the averages as 45.0-43.6, with Doyle slightly ahead.
Robo-pollster Rasmussen has it averaging 46.25-40.75, a decent lead for Doyle.
And everyone else averages 45.4-34.0, the incumbent in a walk. ("Everyone else" here includes St. Norbert College for Wisconsin Public Radio (WPR), Diversified Research for Wisconsin Policy Research Institute (WPRI), and the University of Wisconsin, Milwaukee.)
It isn't unusual for different pollsters to produce consistent differences in repeated surveys on the same subject. These are called "house effects" and they arise from differences in sampling, question wording, interviewer training and whatever else the organization does consistently but differently from what other houses do. Still, it is rare to see differences this large that persist over some 9 months of polling. The trends for each organization are quite stable with little sign of convergence (with the possible exception of Rasmussen.)
The differences are almost entirely about Mark Green, rather than Jim Doyle. The Doyle percentages are tightly concentrated between 43% and 49% regardless of polling firm. For Green, they range from 32% to 47.4%. That large range dwarfs the modest trend upward in Green support.
We might expect this to happen with a challenger. While Green is a well known (and well liked) incumbent in the 8th congressional district around Green Bay, he is not so well known in the rest of the state and, as every challenger, must compete against a much more visible incumbent. The lesser known candidate might be expected to show greater house effects. Subtle differences in question wording or order are less likely to matter with a candidate voters have had four years to make up their minds about. But for a candidate they are just learning about you would expect small differences in wording to matter more. The most obvious case is a vote question that fails to identify the party of each candidate, or worse, one that offers a "or haven't you made up your mind yet" option. But those kinds of differences don't seem to be present here. The question wordings are
Zogby: If the election for governor of your state were held today, for whom would you vote? (Zogby doesn't say so, but I presume the candidates are then listed. Zogby Interactive polling is done over the internet so it is hard to imagine this question not being followed by a list of options to pick from.)
Strategic Vision: If the election for governor were held today, and the choice was between Jim Doyle, the Democrat and Mark Green, the Republican, whom would you vote for?
Rasmussen: Thinking about the 2006 election for Governor, suppose that Republicans nominate Mark Green and Democrats nominate Jim Doyle. If the election for Governor were held today, would you vote for Republican Mark Green or for Democrat Jim Doyle?
WPR/St. Norbert: If the election for Wisconsin governor were held today, and the race were between Democrat Jim Doyle and Republican Mark Green as the major party nominees, would you be more likely to vote for Democrat Jim Doyle, Republican Mark Green, or an independent/third party candidate?
WPRI/Diversified Research: If the election for Wisconsin governor were held today between Mark Green for the Republicans and Jim Doyle for the Democrats, for whom would you likely vote?
UW-Milwakee:
The press release oddly did not include the question wording of the vote for Governor question, though it included all other question wording. The release mentions a large percentage of undecided, suggesting that might have been an explicit option. Regardless, the UW-M survey does not appear out of line with WPR/St. Norbert or WPRI/Diversified.
So on the face of it, these questions don't appear different enough to account for the wide spread and the huge house effects we see for the Green vote.
The nature of the sample and the polling technology may be a better explanation.
Zogby's polling for the Wall Street Journal uses a pool of volunteers from the internet rather than a random sample of telephone numbers. The results are weighted by demographic and partisanship characteristics and is supplimented by a small number of phone calls as well. (
See his explanation for his methodology here.) There is a good deal of effort being devoted to developing reliable methods of internet-based surveys but the jury is still very much out on the question of how reliable they are. At the very least they cannot rest on the strong theory of random sampling that is the basis for all conventional polling. In the case of political polling, they are also likely to recruit respondents who are much more interested in politics than would be the case in a representative random sample. The result would seem likley to advantage the challenger, since a more interested and involved set of respondents is more likely to know and have opinions about a less well known candidate. And indeed, Green does best in the Zogby internet based poll.
Strategic Vision uses conventional telephone polls but samples "likely voters" rather than all adults or registered voters. Again, we would expect this to produce a more informed and involved group of respondents compared to samples of adults, to the advantage of the challenger.
Rasmussen also samples "likely voters" but uses a recorded voice to ask questions that respondents answer by pushing buttons on their phones. The sample is based on a random sample of phone numbers (avoiding the volunteer respondent problem of the internet) but the response rate is extremely low compared to conventional telephone surveys with live interviewers. We might expect this to drive up interest as well, but there is also some reason to think that the effect might not be as great as with the internet based polls. There is some good evidence that people agree to participate (or more often NOT participate) in polls based on "spur of the moment" factors: I'm in a good mood, surveys are fun, or "I'm bored" versus the baby's crying, supper is on the stove, I've had a hard day. So long as the reason to participate isn't correlated with vote choice, even a low response rate doesn't necessarily bias the results. If respondents participate or not BEFORE they find out this is a political survey (and don't hang up when finding it is) then the Rasmussen poll method could produce reliable results. Since it is a sample of "likely voters", it should resemble Strategic Vision in terms of more interested and informed respondents.
WPR/St. Norbert and WPRI/Diversified Research both sampled "adults" without screening for registered voters or for likely voters. That should produce a sample that is most representative of the state but not necessarily representative of November voters. Certainly these respondents should be on average less involved with politics than the samples of "likely" voters from Strategic Vision or the Zogby internet panel or Rasmussen's "likely" voters. That should hurt the lesser known Green in these samples, and indeed he performs worst in these polls.
The UW-Milwaukee survey sampled "residents who intend to vote". Based on the results they appear not too different from the adult samples of WPR and WPRI.
So the "house effects" appear to line up pretty well with the nature of the sample and the likely effect of sample selection on the level of information and interest in the set of respondents. The challenger does best when the sample is more interested and less well when the sample more nearly captures the adult population.
Of course, this begs the question "which is right"? The Green campaign should prefer Zogby while the Doyle folks should like WPR and WPRI. Unfortunatley, we don't have a lot of DIFFERENT polls to choose from or to compare. Zogby and Strategic vision have done the most with 5 and 8 poll respectively. Rasmussen has done 4 and no one else more than 2. This means that the sample selection effects that appear to account for the differences are also heavily confounded with any other house-specific effects, including the internet vs robo-phone vs conventional phone technologies. This makes it harder than it might be to estimate a "best fit" across all the polling. If we had a range of phone polls from different organizations, all sampling likely voters, we would be in a better position to sort out the house effects from the "real" underlying support for each candidate.
The house effects are not limited to vote choice either. When it comes to approval of the job Jim Doyle is doing as governor, there is a striking divergence as well. The figure below plots these trends.
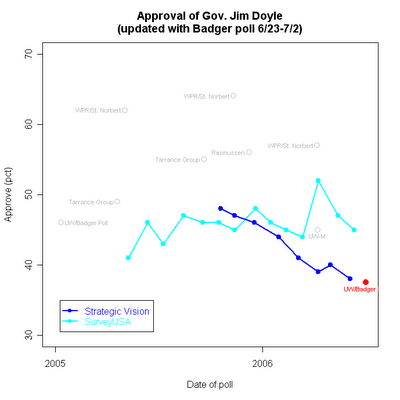
Here the striking comparison is between the substantial negative trend in approval in Strategic Vision surveys vs the generally flat trend in the monthly SurveyUSA samples. (SurveyUSA, like Rasmussen, uses a recorded interviewer.) And as before, we see that the "other" survey organizations produce divergent approval ratings, much higher than those of either SurveyUSA or Strategic Vision.
While it was clear why samples with more interested voters would be more aware of Mark Green, it is less obvious why the "adult" samples of WPR/St. Norbert produce strikingly high approval ratings compared to SurveyUSA's samples which are also of "adults". It may be that there is a pro-Republican advantage among likely voters which could account for some differences in the level of approval. But that doesn't seem able to account for downward trend in Strategic Vision surveys compared to the flat SurveyUSA trend.
A further puzzle is that while Strategic Vision has found approval of Doyle declining, they have not found a decline in the Doyle vote, or an increase in the Green vote (except for their most recent poll). We might expect these two series to move in tandem, but so far not so much.
Survey "house effects" and sample population effects are common, but rarely do we see them as clearly defined as in the Wisconsin Governor's race polling. The potential for such effects to cause confusion and conflicting claims about the race is compounded by the concentration of polls among a handful of firms and methodologies, at least two of which (Zogby and Rasmussen) are open to serious methodological questions.
The lack of regular polling by independent media organizations in the state compounds the problem. No Milwaukee or Green Bay or Madison news organization currently sponsors regular, professional and high quality readings of public opinion, with the exception of the widely spaced and small samples from WPR polling. That means not only citizens but reporters and editors as well are left to pick among the widely varying polls that are available because someone else sponsored them for their own purposes. Not, perhaps, the best state of affairs for journalism in Wisconsin.
(Full disclosure: I serve on the advisory committee of the UW Survey Center which previously conducted the "Badger Poll", which was sponsored by the Capital Times in Madison and the Milwaukee Journal Sentinel. That sponsorship ended last year. Other than my (unpaid) advisory committee duties, I have no ties to the Badger Poll or to the UW Survey Center. Likewise I have no connections to any survey firms.)
Update 7/11: A new UW-Madison/Badger Poll was conducted 6/23-7/2 though curiously not published until today, 7/11. Those data fit very nicely with the story told above, and from a new source not previously part of the data. The Badger Poll has been added to the graphs above, as the last data point in the horse race graph, and with a red highlight in the approval graph.
The Badger poll finds support for Gov. Doyle at 48.6% and for Rep. Green at 35.8% with 15.6% undecided. That is entirely in line with the green line in the top figure for "other polls", a group including Wisconsin Public Radio/St. Norbert College, Wisconsin Policy Research Institute/Diversified Research, and UW-Milwaukee. Those polls have averaged 34.0% support for Green and 45.4% for Doyle. So the Badger results fit right in. What Badger has in common with these others is conventional telephone random sampling (with live interviewers) and a sample of adults, rather than likely voters.
News reports seem to be leading with "double digit lead" but I think that's a questionable interpretation of the data. As the data show, Mark Green is still very much an unknown in the state, outside the Green Bay area of his 8th congressional district. The Badger poll found a whopping 58.7% unable to say if they had a favorable or unfavorable impression of Green. That makes perfectly good sense at this point in the race, though political junkies find it hard to believe how little candidates penetrate the consciousness of the general public this far from election day. Even Doyle, after nearly four years as Governor, cannot be rated by 23.8%.
So realistically, how well can ANY candidate be expected to do when nearly 60% of the public has no impression of him? I'd say doing 35.8% support is pretty good. That support has to be based on a combination of partisanship and dissatisfaction with Doyle, and not a lot because of the attraction of Green. As Green gets better known, he will attract support on a personal basis as well, but that isn't a large part of his support as of today. NOR should we expect it to be at this stage of the race.
The polls that are closer, especially Strategic Vision which uses the same telephone methodology but selects "likely voters" finds a much closer race. But that makes excellent sense. The more interested likely voters are also more likely to have formed an impression of Green, adding that element to their vote choices. Hence a closer race in Strategic Vision.
So why should the news reports NOT lede with the "double digit margin"? Because it is an artifact of name recognition (or lack thereof) rather than a sign of a weak challenger.
If I wrote the lede, it would be "Gov. Jim Doyle, while leading in the horse race, faces an electorate in which 56.6% disapprove of his handling of the job of Governor. Only 37.5% approve of the job he is doing. " Those are remarkably bad job approval numbers for an incument seeking reelection, and provide the basis for a challenger to rise substantially in the polls once the campaign commences. To emphasize the horse race margin is to miss the serious vulnerability the poll reveals.
There is, however, one very puzzling result. While Doyle's job approval is pretty dismal, his favorability rating is a relatively good 46.7-29.5. It seems odd that Doyle gets a favorable rating from nearly half the sample when only 38% approve of his job performance. These two need not track exactly, but that is quite a gap. Perhaps this favorability provides a reservoir of support that is helping overcome the poor job approval numbers.
The job approval also looks bad broken down by party. Dem approval is only decent at 57%, but Independent approval is a disappointing 37.1% and Republicans a predictably low 23%. You certainly can't win Wisconsin with only Democratic support, so Doyle needs to win over a lot of independents who are currently not very impressed with his performance.
One might question whether the approval rating is believable, given the gap between vote (49%) and favorability (47%) and approval (38%) . But here the Strategic Vision polls show a downward trend in approval that ends at a level quite close to the Badger Poll. SurveyUSA's automated polling finds a higher approval as have other polls, though a good bit earlier. At the least, this is a quite unsettling finding for the Doyle folks and source of hope for Green.
Put that together, and the bottom line is that a "double digit lead" doesn't mean much for the fall. Doyle may well win reelection, but it seems very unlikely to be by a wide margin. The nice irony here is that the polls showing a currently close race are most likely wrong, AS OF TODAY, but are probably about right as forecasts of where opinion is heading once the campaign starts activating and informing voters.
Click here to go to Table of Contents