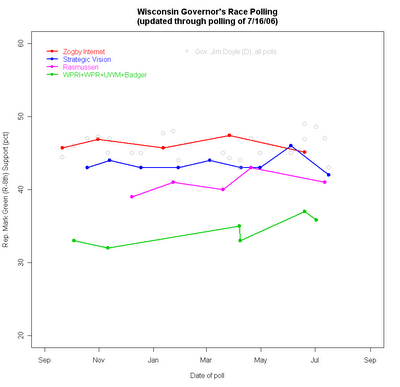
Three recent polls in the Wisconsin Governor's race continue to conflict with one another but all can agree that not much has changed. The new polls are the UW-Survey Center/Badger Poll 6/23-7/2, a Rasmussen Report's robo-poll done 7/12 and a Strategic Vision survey conducted 7/14-16.
I wrote about the considerable differences we have been seeing across pollsters in the Wisconsin race, and those differences remain clearly visible in the plot above. The Badger poll of adults, using conventional telephone methods, finds Doyle at 49% to Green's 36%. That result is right in line with other conventional phone polls of adults, most notably the Wisconsin Policy Research Institute's mid-June poll at 49-37 . The new Rasmussen automated interview poll of likely voters finds Doyle at 47% and Green at 41%, a narrower margin, but one that is almost unchanged since Rasmussen's previous April poll at 47-43. Today Strategic Vision checked in with a conventional poll of likely voters finding Doyle at 43% to Green's 42%, a modest shift from their 45-46 result for 6/2-4 (though a psychological, if statistically meaningless, shift of lead.)
So it is a tossup, a modest lead or a comfortable margin, all depending on which pollster you care to read, just as we saw before. The graph above also makes clear that support for Doyle is quite stable across the polls. It is the Green vote that varies substantially. Also, note that the green line (pun intended) of adult samples shows a modest but steady trend up for Green. We'll return to that below.
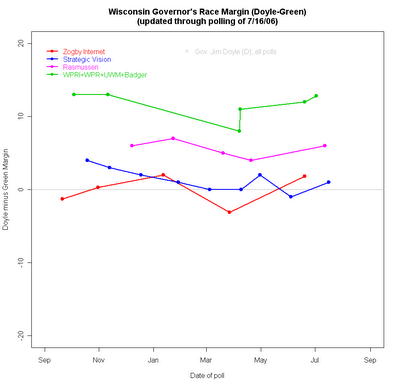
We can shift the focus to "who's ahead?" by comparing the Doyle minus Green margin in each poll. Once more we see that pollster matters most.

The clearest comparison here is between the green line for samples of adults and the blue line for Strategic Vision's samples of likely voters. All these polls use conventional telephone interviews with live interviewers, though there are several different survey organizations represented in the green line. Despite that, both blue and green lines maintain their differences of about 10 percentage points on the Doyle-Green margin. This difference is substantially due to the differences between samples of adults and of likely voters. ("House effects" are also part of it, but we lack enough polls to estimate how big that effect is in this case.) The greater interest and political knowledge of likely voters (meaning they are more likely to be aware of Mark Green), and the modest tendency of Democrats not to turn out at as high a rate as Republicans, makes the likely voter sample appear much more competitive than the sample of adults.
One might assume that voters at the polls will determine the outcome in November, so sampling likely voters would be the obviously correct thing to do. However, it introduces some perils of its own. The most important is the difficulty of determining who is likely to vote, especially this far from election day. Some pollsters rely on just the respondent's report of whether they voted last time. Others ask a battery of questions about registration status, past voting, and certainty that you will vote in the upcoming election. (Strategic vision, like many pollsters, does not describe their method of selecting likely voters on their website.) But it is clear that motivation to vote can change over the course of a campaign, so variation in who is a likely voter can lead to differences in poll results regardless of changes in preferences between the candidates. In some cases, shifts in the likely voter pool may dwarf shifts in preferences, resulting in instability of the poll results due mostly to shifting classification of likely voters. And that classification is, of course, also subject to measurement error, resulting in random movement.
Moreover, if interest in the campaign rises over time and results in initially uninterested potential respondents coming to be classified later as likely voters, we can build in an artificial trend by accident. If those who are activated to vote by the campaign have a partisan bias, then their inclusion in later samples will result in an apparent trend in the direction of their bias. In one sense this is absolutely correct-- as recent campaigns have shown, elections are as much about mobilizing your supporters as winning new converts. But so long as the classification of likely voters is subject to fluctuation and trend there will be shifts in measured support that we might not want to confound with opinion change in the population.
Samples of adults don't face these problems of definition of the pool of voters. Thus trends in adult samples are generally not confounded with changes in interest in the race or motivation to vote. That's useful if we want to follow the process of activation and candidate persuasion.
For example, at this stage of the race, I'm most interested in Mark Green's progress as he introduces himself to the electorate. Current vote estimates will obviously be a poor reflection of his ultimate strength at the polls because many people are just getting to know who he is (if they are yet aware of him at all.) Trends in impression of Green (his name recognition and favorability towards him, perceptions of his issue positions) over time would be very important to observe without any chance of confounding these trends with the growth of motivation to vote, which would affect samples of likely voters. If I'm working for Green, I want the best estimate of that trend as a measure of our progress in reaching voters. I don't want it confounded with changing the denominator by including more (or fewer) "likely" voters. Remember that green line in the top figure? It shows that Green has had a positive trend in vote support among adults. For a challenger who is not yet advertising, and so is relying on free ("earned") news coverage and personal appearances, this is a good trend. As an estimate of his November vote, it is, of course, far too low. But it does reflect both his current standing and the modest but steady upward trend. That will move more rapidly as both candidates put up their ads.
We can also learn more from an adult sample than a likely voter one. If I have a sample of adults I can always estimate who is more or less likely to vote, and calculate an unbiased vote estimate from that, discounting the preferences of those less likely to turn out. If all I have are "likely" voters, I can never use that sample to estimate the potential for mobilization because by definition I excluded those not yet motilized from my sample.
Of course, campaigns may prefer to rely on "likely" voter samples to minimize survey costs from talking to too many respondents who are clearly unlikely to turn out. But for analysis of what is happening in the campaign, samples of adults have considerable advantage over samples that exclude some potential voters right off the bat. Likewise news organizations or others who are just interested in the "bottom line" of the horse race may not want to engage in analysis of the survey and for them the sample of likely voters gives them a simple number to report without having to explain how "likely voter" was defined, and how much that might matter as the campaign moves along.
Given good analysis, you should be able to learn everything from a sample of adults that you can learn from a sample of likely voters. But you can also learn OTHER things from adults that can't be estimated at all from samples of only likely voters. Adults are easier to sample accurately and the population of adults only changes at a glacial pace. The cost of a larger sample of adults versus a smaller sample of likely voters is the primary reason to prefer likely voters. It also takes more work to get the greater information out of the adult sample than if you just place your (somewhat blind) faith in the poll's ability to identify "likely voters".
Click here to go to Table of Contents