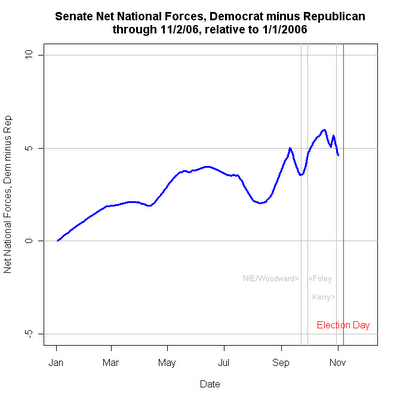
This is certainly a good year for Democrats, but how good? And what are the national forces at work? I can estimate a summary of national forces to answer these questions.
I estimate a model that pools ALL Senate race polls, then iteratively fits a local regression (my usual trend estimator here) while simultaneously extracting a race-specific effect. This procedure has the effect of removing the difference between PA (with a strong Dem lead) and AZ (with a substantial Republican advantage) and likewise for all the states, effectively centering them at zero. The trend estimate that results then will move up if across most states the trend has been up, while if pro-Dem and pro-Rep movements equal one another, the national trend will be zero. There is no fixed metric for this national force, so it is convenient to pick a zero point for identification, in this case January 1, 2006.
The estimator finds that the Democratic margin has grown by 5 points across all races due to this national force. Where Republicans have enjoyed increased support, they have had to do it in the face of this opposing wind, while Democrats who would have been trailing by 5 points if January conditions still prevailed, will now have a "wind assisted" tossup race.
The dynamics of this national force have been generally increasing all year but with significant partial reversals at times. From a June high of about 4 points, this force shank to 2 points in August, then surged to 5 points by September 1. A brief improvement for Republicans took place in early September. At the time Republicans claimed to see new movement in their favor, and these data lend some support for that claim. However, that trend was sharply reversed after September 24 with the first publication and subsequent release of the National Intelligence Estimate followed by Bob Woodward's book, State of Denial. This was followed a week later by the Foley scandal, and once more Democratic advantage increased to about 6 percentage points. In the last two weeks of October there was a brief move in a Republican direction, then back to favor the Democrats. As of November 2, however, the national forces have again moved in a Republican direction, this time somewhat more strongly. While it is tempting to explain this as a result of Sen. Kerry's verbal difficulties, the downturn started before the joke-gone-wrong, so perhaps the Senator does not deserve all the credit for the 1.5 point decline since mid-October. As it stands, the estimate is only a little under 5 points. However, as a national force, common to all races, this decline of even 1.5 points is enough to be crucial for either party in Virginia and Missouri. If it moves more, it could also affect the Tennessee or Montana races as well (and conceivably Maryland.)
For my money, these are sensible estimates of the magnitude of national forces at work in this election. A gain of 5 points in the margin turns a 50-45 race into a 47.5-47.5 tie. Estimates much bigger than this would seem too large to be plausible as they would suggest too many races become competitive or Democratic leads.
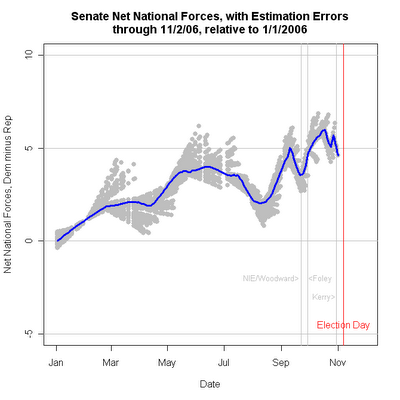
The method I use here does not lend itself to the usual confidence interval estimates. But some sense of the variability of the estimator can be seen below. The estimation errors, indicated by the gray dots, are estimates of where the trend would be IF the series had stopped on the day represented by the dot. This method is sensitive to last observations and while the fit is quite stable when there is abundant data on both sides of a point of interest, it is often a poor predictor of what will come next. The deviations of the gray dots around the line show when the trend would have gone up more, or down more, than the blue trend estimator finally settled on. The errors are worse near points of change in direction, which makes sense. While the variability is not trivial, and indicates considerable uncertainty near changes of trend, the area covered by the gray dots is still relatively small compared to the size of the effect being estimated. The practical implication is that we have to be cautious in suggesting that the current trend will continue, because a change in direction is not well predicted by the model. That said, we can be reasonably confident that the trend estimator would not be radically different if we add more observations. (Which we won't do, after November 7.)

Click here to go to Table of Contents