Monday, October 31, 2005

The Supreme Court will shift only slightly right


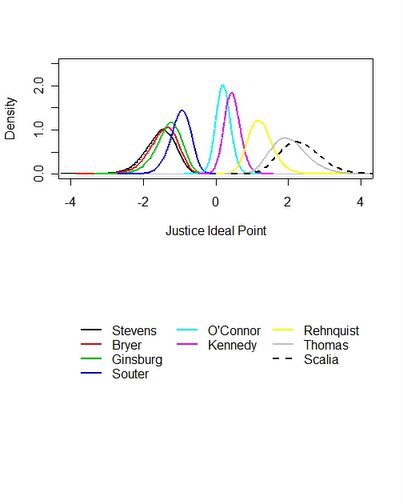
Distribution of Bayesian Ideal Point Estimates of Rehnquist Court Justices.


The nomination of Judge Samuel Alito to replace Justice Sandra Day O'Connor has dramatically changed the public debate over the nominee compared to that of either Harriet Miers or now Chief Justice John Roberts. Roberts high quality but lack of a paper trail allowed his hearings to avoid direct confrontation over his positions. Miers weak qualifications allowed judicial conservatives to dominate the debate, again avoiding a direct ideological and partisan confrontation. Judge Alito, in contrast has very high qualifications, which I think cannot seriously be questioned, plus a long and clear track record of judicial opinions which will be strongly attacked by liberals and defended by conservatives. The hearings will focus on the most extreme statements that can be found by liberals in his published opinions, a defense of his views by conservatives, and an interesting opportunity to see how this plays out with the mass public. (We visited this issue before here.) It is going to be fun. This is the judicial war that both extremes wanted to have.

But how much is it likely to matter for the alignment of the Court? Both sides will claim much but the evidence is not so much.

The key to any Court is the median voter, the decisive fifth vote for any decision. In the Rehnquist Court, that vote was O'Connor's. In the Roberts Court (with Alito replacing O'Connor) that fifth vote will be Kennedy's. But as the figure above shows, Kennedy is only slightly to the right of O'Connor. Even if we assume Alito is as conservative as Scalia, and that Roberts turns out to be to the right of Rehnquist, there remain only four votes for very conservative positions. Someone must convince Kennedy to join the four most conservative Justices. (And I continue to wait for the evidence on Robert's positions.)

This configuration raises an interesting problem for the Roberts-Alito additions to the Court. Kennedy was only slightly to O'Connor's right. But there will be a substantial gap between Kennedy and the group of Roberts-Alito-Thomas-Scalia. There will be a similarly large gap between Kennedy and the group to his left: Stevens-Bryer-Ginsburg-Souter. If Roberts and Alito turn out to be near Thomas and Scalia, Kennedy will actually be closer to the liberal wing. As such, a stronger conservative wing of the court could drive the swing vote to the left. The conservative Justices will have to make sure this doesn't happen, and in doing so will have to moderate their views enough to win Kennedy's support. The liberals will similarly have to moderate their views to win Kennedy over to their side.

Regardless of where the wings of the Court stand, Kennedy is the key vote. With O'Connor on the Court, it was possible to win a majority by gaining either Kennedy's or O'Connor's vote. The figure shows considerable overlap between their estimated locations. The liberal wing could win with either O'Connor's or Kennedy's votes, and sometimes both. The conservative wing required both Kennedy and O'Connor to win.

Now Kennedy stands alone in the middle of the Court. Neither wing can win without him. This gives him tremendous leverage to shape opinions to his satisfaction, and requires both wings to be far more deferential to his views.

The upshot is that conservatives are likely to be disappointed once more with the outcome of a new conservative appointment to the Court. Despite adding Roberts and Alito, the Court is likely to remain a center-right Court, and not a "right-right" Court. Not unless Kennedy changes his positions.

So sit back and watch the huge fight we are going to see over Alito, with claims that the fate of civilization as we know it hinges on his confirmation or defeat. But don't be shocked when the Court fails to shear sharply to the right after his confirmation.

If you want to look for the day of real change in the Court, wait for the next appointment after Alito's. And remember that President Bush had 39 months still to serve. The odds are good that he'll have at least one more appointment. If one of the liberals, or Kennedy, retires, that appointment will be the one that shifts the median in a big way.

(The ideal points presented here are my estimates based on the Justices voting on decisions during the Rehnquist Court. For much more excellent analysis of this see the work by Martin and Quinn here. Their work produce slightly different estimates, but the same qualitative conclusions.) Posted by Picasa

Saturday, October 29, 2005

Second Term Jinx, Part I


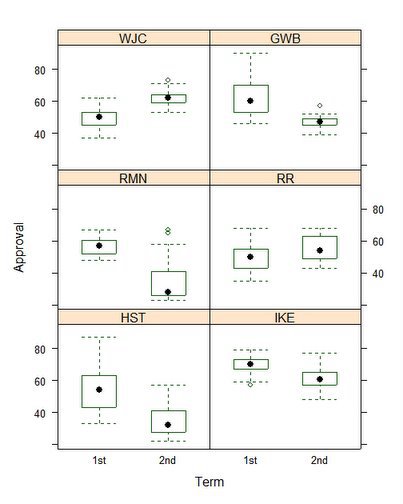
First and second term presidential approval, 1945-2005.

There has been a predictable flurry of articles on the presidential second term "jinx". Some examples are The New York Times, The Christian Science Monitor, and Newsday to name only a few. This morning's Milwauke Journal Sentinal has a rare sane view.

The evidence for second term decline is relatively weak. Two of the five two-term post-war presidents have improved their second term standing over that of the first. (The final story is not yet written for Bush.) Truman, Ike and Nixon all are lower on average in the second term, though Ike's low isn't that low. Reagan has a slightly higher median in the second term than the first. Clinton breaks the mold with clearly higher second term ratings than first, and that despite being impeached!

But no matter what, five cases do not amount to an inevitable second term jinx. Truman had post-war economic adjustments and then Korea. Ike had a weak economy in the second term, Nixon had Watergate, Reagan Iran-Contra and Clinton Lewinsky. So scandals haven't been uncommon, but not universal either.

President Bush's current problems are much more like Truman 's and Eisenhower's problems-- driven by political decisions and policies started in the first term. With the Libby indictment this week, there will be a "scandal" as well, but it wasn't the scandal that drove his ratings down this year-- it was the failure of the social security proposal, the long term costs of the war, and then topping that off with gas prices, hurricanes and a less than brilliant nomination.

It is hard to argue that 3 out of 5 cases constitute a clear pattern of poor second terms. Rather it looks like a toss up.

There is another problem with the second term jinx argument: it ignores those presidents who had a first term "jinx" and never got to serve the second term. Recognizing this selection bias in second term jinxes wipes out any remaining argument for systematic decline in the second term.

We have five postwar presidents with 2nd terms (not counting Bush) three of whom do clearly worse in the second term. Compare that with the four ONE term postwar presidents who had such bad first terms they couldn't win reelection. (Johnson, and Ford are special cases, neither initially elected but both eligible for another term). So it looks to me like four presidents had "jinxes" in the first term, and three of five had "jinxes" in the second term. It isn't a jinx.

When you do bad in the first term, you don't get to have a second. When you do ok in the first, there is still a just about even chance (3/5) that the second term is worse than the first. I conclude there is no systematic difference between first and second terms, at least in presidential approval ratings.

I'll have more to say on this soon. Posted by Picasa

Public Understanding of Miers Withdrawal


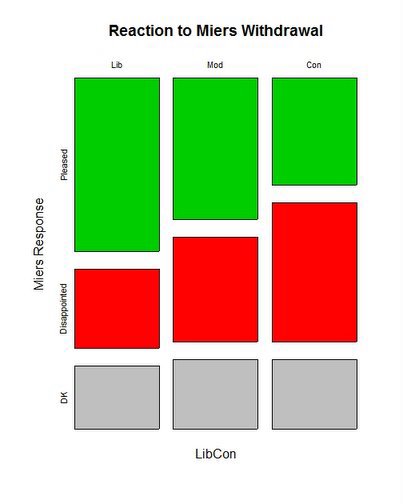
The Gallup/CNN/USAToday poll, taken 10/28, N=516, finds that response to the Miers withdrawal follows partisan and ideological lines, with liberals more pleased and conservatives more disappointed by the withdrawal. The CNN story on the poll is here. Gallup has a Frank Newport writeup of the poll here. (Free as of Saturday, but subscription required after that, I think.)

The interesting thing is that the most vociferous opposition to Miers came from the most conservative wing of the Republican party, yet among the public conservatives were more disappointed than pleased by the withdrawal. How come?

One simple partisan answer would be that liberals like seeing the President twist slowly in the wind, while conservatives are disappointed by anything that hurts the President. While plausible in general, this story line doesn't address the giddiness at the National Review web site on Thursday morning:

CORKS [Kathryn Jean Lopez]
I'm getting some of those e-mails too. But no champagne here. No gloating. Just relief. It was the right thing to do--withdraw--and it has been done. Super. Was this whole thing unnecessary? Yes. But I don't think that's our fault. The nominee made no sense. So it's over. Live and learn. Posted at 09:34 AM

RE: CORKS [Jonah Goldberg]
Kathryn -- That would be easier to buy if you weren't wearing a giant party hat and drinking out of your shoe and Chaka wasn't in the mailroom snockered out of his gourd xeroxing his butt. But, yes, you're right. Blessed are the peacemakers.
Posted at 09:37 AM
As any regular reader of conservative opinion can attest, the criticism from the "Intellectual Right" was overwhelming, and based on both Miers judicial philosophy (or lack of same) and limited qualifications compared to many other prominent conservative jurists and legal scholars. Among "Social Conservatives", criticism more commonly focused on whether Miers was a reliable conservative, or might show a moderate-to-liberal streak that would not provide the kinds of outcomes that are of most concern to social conservatives. So whether one is a reader of The Weekly Standard or Eagle Forum (or a daily listener to Rush, for that matter), the message was the same, a poor choice who should be withdrawn.

Pitted against these conservative messages were those coming most prominently from President Bush himself, and the White House, combined with those religious conservatives such as Dr. James Dobson who spoke in favor of Miers. Both the White House and its surrogates talked about Miers religious faith, evangelical views and the "near unanimous" opposition to abortion in her church.

So the messages from conservatives and Republicans were quite divided in their valence towards Miers' nomination. What about the liberals and Democrats?

Some prominent Democrats, most notably Senate Minority Leader Harry Reid, supported Miers but the vast majority remained quiet or expressed concerns. But none launched a full attack against her qualifications or judicial philosophy.

So what does this configuration of elite messages suggest about public opinion in response to Miers? The most important point is to appreciate how little attention the mass public pays to complex issues such as this that delight Washington and us political junkies. As a previous post here mentioned, the level of "don't know" response to Miers averaged over 30%. But even that does not mean that the 2/3 who did express an opinion about her nomination understood the context of the debate elite opinion makers were waging. The nature of the mixed signals that were coming from elites suggests that the public was even less able than usual to make sense of the Miers nomination and its issues.

UCLA political scientist John Zaller, author of "Nature and Origins of Mass Opinion", argues that citizens look to elite signals for considerations that support their positions. When the message is entirely one sided (think aftermath of 9/11) then the public moves more or less uniformly in the direction of elite consensus. When there is division, citizen look for cues as to who to believe. The most prominent of these are partisan cues. Here think of the run-up to the Iraq war. A unified Republican party sent unambiguous messages to Republicans and conservatives in support of the war (despite a considerable isolationism visible two years earlier in the 2000 campaign.) The Democrats sent a mixed message, with both supporters and opponents of the war. Mass opinion was overwhelmingly in support of the war as a result, with much more division among Democrats in the mass public than among Republican partisans.

So what happens when both parties are sending mixed signals, as in the Miers case? Conservatives and Republicans would be exposed to two conflicting messages-- both from usually trusted sources. Because most people pay limited attention to politics, the President's message would be expected to affect mass Republican opinion more, simply because even among Republicans only a small proportion are avid consumers of conservative sources such as George Will, The Weekly Standard, National Review, the Wall Street Journal or Rush. A secondary source of information was through the "mainstream" media coverage of the controversy, which Fox, CNN, MSNBC as well as the broadcast networks made prominent parts of their coverage. The upshot is that any conservative or Republican had to decide not only who to believe but also to sort out what the issues really were. The difficulty of this task was guaranteed to produce a split in conservative opinion, with the advantage going to the best known, most widely visible, and most familiar source-- President Bush. However, the counter message was also available and produced a significant split in opinion. The result, a split among conservatives of 34% pleased with Miers withdrawal and 44% disappointed. Such a small edge to the President's position is testimony to the strength of the conservative critique of Miers.

Among Democrats, the message was much more muted. Despite a few supporters, such as Reid, the overwhelming response was... silence. Democratic leaders stood on the sidelines and watched the Republican death match. As a result, Democrats failed to send strong signals that a Miers defeat (or withdrawal) was clearly a good thing (for their side), but they didn't send a strong signal in favor of her either. This left the mass Democratic partisans to fall back on their partisan perception of the debate, and overwhelming disapproval of President Bush, in order to judge the meaning of the Miers withdrawal. The result was Democrats and liberals were a bit more united in their response to the withdrawal than were Republicans and conservatives-- a rarity in itself. Liberals split 55% pleased to 25% disappointed, while conservatives split 34%-44%.

Roberts drew enough Democratic support that the partisan response to him was relatively muted, while Republicans were nearly unanimous in support. Republicans split 68-8% in favor of Roberts, while Democrats were evenly divided 31-33% in a Pew poll taken September 8-11, just before the Senate hearings.

Both of the Miers and Roberts figures would be expected to be more extreme with more typical homogeneity of partisan elite messages. If the next nominee provokes unified partisan messages, we should expect to see a much more divided response in mass opinion. Posted by Picasa

Thursday, October 27, 2005

Miers v. Roberts


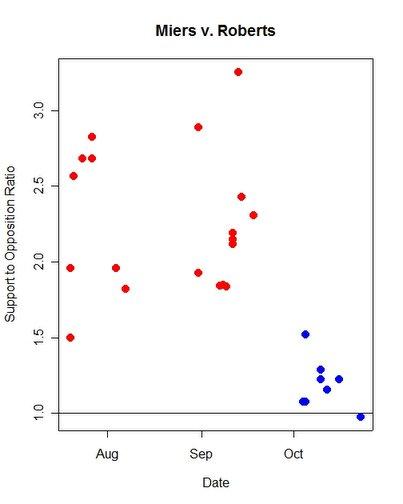
Support to opposition ratio. Roberts in red, Miers in Blue.


Harriet Miers withdrew her nomination for the Supreme Court this morning. President Bush "reluctantly accepted" her decision to withdraw.

While Miers drew strong opposition from the conservative legal movement, her support in the mass public never approached the levels of support for now Chief Justice John Roberts.

Polling on Supreme Court nominees is tricky because large portions of the public pay little attention and lack information to support their judgments. In Robert's case, the median "Don't Know" response was 27%, and the mean 29.5. Even at the end of his confirmation process, in September, the median rate of "don't know" responses was 27%. For Miers, who was a nominee for less time, the median DK response was 31.5% and a mean of 34.6%.

To avoid confounding "don't know" with opposition, I look at the ratio of support to opposition, removing those without an opinion. This lets us focus on the more attentive public who may have more meaningful opinions, and avoids depressing apparent support due to high levels of DK. For example, Roberts median support was only 50%, which alone suggests weak support. However, his opposition median was only 24%, with the rest not holding an opinion. This results in a 2-1 support to opposition ratio, and a healthy confirmation in the Senate. As the figure shows, there was little trend in the support ratio for Roberts, which mostly ranges between 1.9 and 2.6 throughout his confirmation process.

The Miers support ratio is strikingly lower. Her median ratio was only 1.2, with half of the polls putting this support between 1.07 and 1.24. Her highest support ratio was equivalent to Robert's lowest ratio. And in the last poll released before her withdrawal, Miers' support ratio had fallen below 1.0, to 0.98 in the Gallup/CNN/USAToday poll of 10/21-23.

The Miers nomination collapsed due to strong conservative elite opposition and lack of support in the Senate, rather than public opposition or outrage. But the public perceptions reflect the failure of the administration to build a convincing case for her qualifications.

(Data in the figure reflect all public polls asking some form of the question "Do you support or oppose John Roberts/Harriet Miers nomination to the Supreme Court". There is quite a bit of variation in wording, which I have not statistically modeled in the figure. Such modeling would probably reduce the variation a bit for both candidates but would certainly not affect the central conclusions.) Posted by Picasa

Tuesday, October 25, 2005

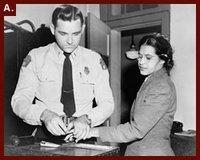
Rosa Parks, 1913-2005

This isn't the usual post here, but I cannot let Rosa Parks' passing go without saying something.

My viewpoint is of a white boy growing up in a small town outside of Montgomery. I missed the bus boycott (I was 1 when it happened), but it was still talked about when I was becoming aware of the civil rights movement as I started school in 1960. If that seems young for political memories, take a moment to put civil rights and school integration into the context of small town Alabama of the time. For whites this was an upheaval of the social order. The New York Times obituary describes that social order well:
On Montgomery buses, the first four rows were reserved for whites. The rear was for blacks, who made up more than 75 percent of the bus system's riders. Blacks could sit in the middle rows until those seats were needed by whites. Then the blacks had to move to seats in the rear, stand or, if there was no room, leave the bus. Even getting on the bus presented hurdles: If whites were already sitting in the front, blacks could board to pay the fare but then they had to disembark and re-enter through the rear door.


These mundane injustices were, of course, only the tip of the iceberg of racism that pervaded my hometown and state. My home county was 70% black, but had no blacks registered to vote in 1960. Education was, of course, segregated and anything but equal. All the businesses on the two blocks of "main street" were white owned and none employed blacks, at least not "out front" dealing with customers-- quite a few blacks worked in the back, doing hard chores. And the police and sheriff were friends of mine, but not all that interested in equal justice. And of course the churches were as rigidly segregated as the schools. The Klan was strong in my home county.

So when Rosa Parks didn't get up for a white man to sit, it was a radical action, one that my students today cannot really imagine, let alone understand as white southerners of my generation can. She challenged a social system that was an abomination and a mockery of the words of the Declaration and the Constitution (as amended.) And that act required a courage that surpasses my comprehension.

But that courage ceased to be rare after Rosa Parks' example. In Montgomery at first, with the boycott and then throughout Alabama and the south, African-Americans risked much and sometimes lost their lives in the pursuit of equal rights. The famous are remembered and revered, as they should be. But I also remember the un-famous who integrated the schools in my little town, who registered to vote when their names were noted by white officials and who spoke out when speaking was so terribly lonely. And continued to do so year after slow year of gradual progress. Their courage was at least as great as that of the famous.

What Rosa Parks did for black folks is obvious. From her small act grew a mighty movement. So what did Rosa Parks do for me, a white boy from Alabama, and all my kind? She saved our souls. The social order I grew up with was a mortal sin, damning the souls of all of us who supported and perpetuated and benefited from that evil. Thank God for Rosa Parks and all the brave souls who followed her. My kind may yet have a chance at forgiveness and salvation. Posted by Picasa

Tuesday, October 18, 2005

SurveyUSA 50 State Approval

SurveyUSA has new 50 state approval ratings that are quite interesting. The data at their site are here.

SurveyUSA uses automated polling that is open to question by most survey research standards. MysteryPollster.com has discussed the methodological issues here and here. I think the validity of their polling is an empirical question, and by and large their results appear to track well with conventional surveys. Perhaps I'll post on this later, but for now, let's take their results at face value. And you'll see below a very nice match between their results and national surveys using conventional methods.

My graph compares President Bush's approval in June (before either the Vacation with Cindy Sheehan or Katrina or Harriet) and his rating in October. (SurveyUSA took the October poll 10/14-16/2005, with 600 respondents in each state. The June survey was 6/10-13/2005, also with 600 interviews per state.)

What is interesting is the uniform drop in approval of President Bush across the states. The regression fit (the purple line in the figure) is OctApprove = -5.130 + 1.0086*JuneApprove. You can fiddle with adding differences between Bush states and Kerry states, but the difference is quite small. After trying several specifications, I think the simplest model with across the board decline is the best. (See Philip Klinkner's comments at PolySigh for a somewhat different view.) While there is an obvious relationship between states won by Bush and approval levels, the critical fact is that ALL states (except Oklahoma) show a shift downward, below the diagonal line in the figure, representing stable approval levels.)

So the conclusion is a little over a 5% decline in approval between June and October that crossed partisan state lines. Given the year-long decline of -.03% per day reported in my previous posts, the trend would account for -3.75% of this decline (125 days x -.03 per day), with the post-Katrina shock taking the remaining -1.38% change. This is very close to the estimates based on national polling reported here, of -1.3472 (after adding the latest Gallup poll into the data. It was -1.2% before the October Gallup data came in.)

So what is to be said? The President's problems are very widespread. This is not a "Blue State versus Red State" phenomenon. Instead, the President is suffering equally everywhere. The causes of the decline are widely reported, though poorly documented. We all cite gas prices, the war in Iraq, Katrina and so on. There is little empirical evidence for which of these (or other) variables are really driving approval ratings down. Regardless, this is a presidency in trouble across the board.

Of particular political relevance are the Red states in the figure that are below 50% approval in BOTH June and October. There are sixteen (16!) states that Bush carried in 2004 but in which fewer than half the adults approve of his handling of his job in either June or October. The midterm election is fast approaching. These are not encouraging signs for Republican candidates, or (especially) potential candidates. Don't count on the Democrats to produce a coherent and winning platform, but Republicans must fear self-inflicted wounds that criple them even against a poorly organized opposition. Should the Democrats put together a coherent critique AND positive proposals for change, this could be a devastating midterm for the hoped-for long term Republican Majority we heard so much about in January and February. If Clinton squandered his second term with Monica, Bush may also be losing his chance to create an enduring partisan legacy for his party and for the conservative movement. The "political capital" of January appears to have been spent, and then some. Posted by Picasa

Thursday, October 13, 2005

Two views of Presidential Approval, Oct 13.


Presidential Approval, January-October 13, 2005. Posted by Picasa

Two views of President Bush's job approval ratings come from the recent flurry of new polls. The first focuses on recent events. I've been calling these "Post-Katrina" but perhaps should now call them "Post-Harriet".

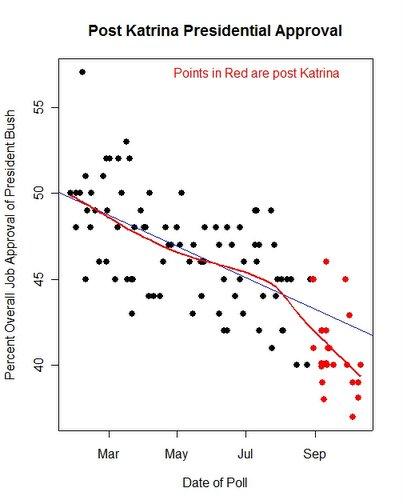
This first graph shows the new results with a total of 26 post-Katrina polls (in red). The decline in the President's approval is clear visually, and the local trend line in red shows how sharply the trend has departed from the blue linear trend for PRE-Katrina polls. (Note the close fit of red and blue trends before August.)

The model, corrected for differences among polling houses, now estimates a Katrina effect of -1.2%. Prior to Katrina, approval was falling at a rate of -.03% per day throughout 2005. So the post-Katrina drop is equivalent to 40 days of pre-Katrina trend.

This will be the last estimate I give of the "Katrina" impact. I believe events have now moved on, so attributing any further change to Katrina, is probably a confounding of effects. The estimate of that effect has remained stable at between -1.1 and -1.3 for a while now, so I'm satisfied with this estimate.

The bottom line: the President's approval has fallen all year, declining about 1% every month since January. But since August we've seen a sharper drop. One important remaining question is whether the rate of decline has also increased, after we take account of the immediate Katrina effect. So far that can't be estimated because it is confounded with Katrina. But the next month should give us the data for an answer.

The next graph takes the long view of the entire Bush administration. Due to a change in Blogger that I can't seem to circumvent, this graph and comments appear in the next post, rather than right here, as I might wish. My HTML skills aren't what they might be.

Two views of Presidential Approval, Part 2


Posted by Picasa

Presidential Approval, 2001-2005

The most crucial observation here is that over the course of President Bush's administration, his approval rating has never fallen as fast as it has since August. This is not "free fall" (the Elder President Bush fell faster in the fall of 1991), but the drop since August 1 is disturbing. The effects of Katrina are significant, but these are now absorbed in the rating. The current difficulties with the Miers nomination, the ongoing Iraq casualties and gas prices (even if they are moderating a bit) are now going to drive the approval ratings. So far the administration has failed to regain control of the agenda to arrest this decline.

And as bad news brings bad news, the Miers nomination has probably added to the President's problems. Not that all that many citizens are as glued to the coverage as we junkies are, but because the tone it sets for coverage of the President is likely to continue to reflect his troubles rather than his successes. Approval of the Iraqi constitution may help a little, but we will pass 2,000 U.S. troop deaths within the next 6 weeks, and that will almost certainly produce renewed focus on the cost of the Iraq war. If the Miers hearings are underway at about the same time, the President could face damaging news on two fronts. The President's attempt this week to reassert the positive case for our involvement in Iraq was generally well reviewed but almost immediately lost in a week of other controversey. His talk with the troops today probably isn't going to help matters.

Second terms often seem to depend on second string players in the White House. Whether it is the new players, the distractions of grand jury investigations, a loss of agenda control by the President (after a failed Social Security initiative), or uncontrollable events both natural and political that have taken their toll, the result is a seriously damaged presidency. Someone in the White House needs to take control and make better decisions or the 2006 elections may slip away--- even if Democrats are not, so far, producing a clear alternative message. The elections may be over 12 months away, but candidate recruitment is now, and rational Republican candidates must see a hard road while Democrats are encouraged by the current turmoil.

Thursday, September 29, 2005

Roberts Confirmation Vote


Votes against confirmation of Supreme Court nominees, 1953-2005 Posted by Picasa

Chief Justice Roberts was confirmed today on a 78-22 vote in the Senate. Coincidentally, this vote margin resembles the votes on the man he replaces, the late Chief Justice Rehnquist. Rehnquist was initially confirmed as an Associate Justice by a 68-26 vote in 1971. His elevation to Chief Justice in 1986 drew more opposition, 65-33.

Roberts drew about double the opposition that recent appointees have faced, with the exception of Rehnquist and Justice Thomas, who was confirmed on a 52-48 vote in 1991. (Fortas2 in the figure is a cloture vote in 1968 which failed. President Johnson withdrew the nomination, and Fortas resigned from the Court the next year.)

In the Roberts case, confirmation was assured by the united Republican majority despite pressure from Democratic interest groups which urged "nay" votes from Senators of their party. In the end, 22 of the 44 Democrats voted against the Roberts nomination.

And here is who voted how, among the Dems. (Not sure why the spacing is bad here.)


Dem-Yes Dem-No
Baucus, Mont. Akaka, Hawaii
Bingaman, N.M. Bayh, Ind.
Byrd, W.Va. Biden, Del.
Carper, Del. Boxer, Calif.
Conrad, N.D. Cantwell, Wash.
Dodd, Conn. Clinton, N.Y.
Dorgan, N.D. Corzine, N.J.
Feingold, Wis. Dayton, Minn.
Johnson, S.D. Durbin, Ill.
Kohl, Wis. Feinstein, Calif.
Landrieu, La. Harkin, Iowa
Leahy, Vt. Inouye, Hawaii
Levin, Mich. Kennedy, Mass.
Lieberman, Conn. Kerry, Mass.
Lincoln, Ark. Lautenberg, N.J.
Murray, Wash. Mikulski, Md.
Nelson, Fla. Obama, Ill.
Nelson, Neb. Reed, R.I.
Pryor, Ark. Reid, Nev.
Rockefeller, W.Va. Sarbanes, Md.
Salazar, Colo. Schumer, N.Y.
Wyden, Ore. Stabenow, Mich.


Wednesday, September 28, 2005

The Long View of Gas Prices


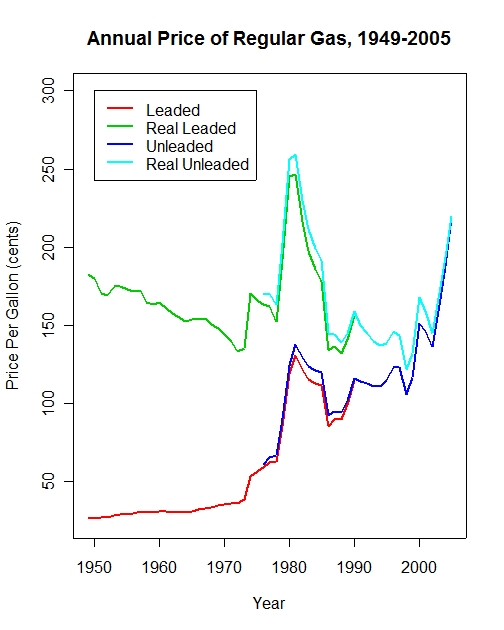
Annual gas prices, 1949-2005 Posted by Picasa

Barry Burden's comment to the previous post drew my attention to a longer run gas price series (Thanks Barry!) and to a nice graph of the data by Professor Robert Sahr at Oregon State University. I've updated his graph to include 2005 prices (so far) and convert the real series to 2005 prices. I've also kept the distinction between leaded and unleaded, so you can see the modest differences.

That graph above shows the long run decline in real prices until 1998, with notable exceptions for the 1974 shock and the 1979-1985 period.

It is interesting to compare the 1974-1981 real prices with the 1998-2005 real prices. In both cases a short run-up, a modest decline and a large spike in prices. In real terms we are still a bit ahead of the $2.33 peak in 1981, with 2005 prices averaging $2.19 for the first 9 months of the year. But the dynamics of prices, and the political implications, remain interesting.

And of course the unanswered question is whether we will see the same sharp decline in real prices that the 1980s had.

By the way, note that the Sahr graph is very well documented. The source and technical notes are clear and the graph is less jumbled than my own. Perhaps more important for visual impression of the trends, compare his "landscape" graph with my "portrait" one. My narrower graph makes the up-and-down dynamics appear stronger. His wider graph, makes these trends appear less dramatic. Same data, so no "real" difference, but perhaps an important psychological effect that may matter for how we interpret the data. Mine is what those who point with alarm would like to stress, while his flatter graph suggests less reason to panic. Mine also looks more alarming because the price rise in 2005 makes the end point rise dramatically compared with his 2004 endpoint.

Here is my graph in a more landscape aspect ratio for comparison. Neither is "right" or "wrong" but we all need to be aware of how visual perception of the same data can affect our interpretations.


A "landscape" view of gas prices. Posted by Picasa

Data Source: Energy Information Administration AER Table 5.24 (bottom of the page). I adjusted the data for 2005 prices based on the June 2005 CPI, excluding energy and averaged weekly nominal prices for 2005 to get the annual estimate for 2005. That obviously will change over the rest of the year.

About those gas prices...


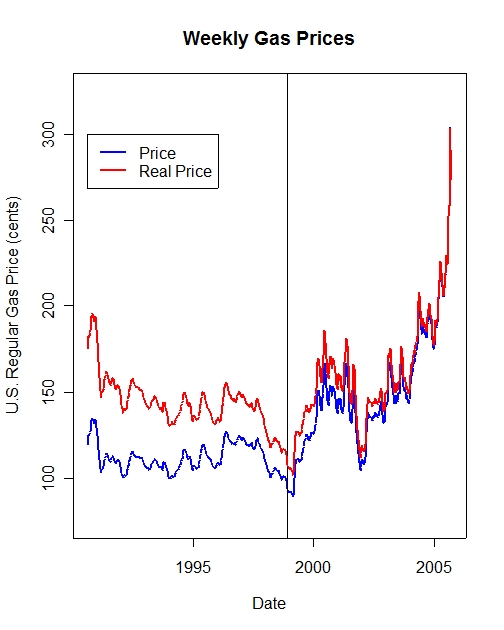
U.S. gasoline prices, 1990-2005. Posted by Picasa

We've all paid at the pump, but what does the actual data look like? Here are the nominal and real price series for regular gas, since 1990. The data are weekly averages for the U.S. from the U.S. Department of Energy. The real prices are calculated based on the CPI (EXCLUDING energy, and seasonally adjusted) with $1.0=August 2005.

Oh, and that vertical line in the graph, that's when I bought my SUV. Good timing, huh?

(P.S.-- This is a revised graph. Wrong real price variable earlier. Ugh. It was too late to post, I guess.--chf 9/28)


What about regional variation in pricing? Here it is, in nominal prices.


Regional Gas Prices (Nominal prices), 1990-2005 Posted by Picasa

As you can see, there is a bit of regional variation, but the correlation across regions is quite high.

Data: DOE Gas Prices are here.
The CPI is from FRED (at the St. Louis Federal Reserve), here.

Tuesday, September 20, 2005

The bad news: Katrina is the GOOD news.

Of the results in the latest Gallup/CNN/USAToday poll, the following must surely be the worst for the White House: The President's handling of the Katrina aftermath is his HIGHEST approval rating. USAToday reports the following table:


2. Do you approve or disapprove of the way George W. Bush
is handling the following?


ApproveDisapprove
The response to Hurricane Katrina4157
Overall job approval4058
Foreign Affairs3858
The economy3563
The situation in Iraq3267


(See the full results of the poll at USAToday here.)

In short, President Bush's standing with the public is currently being driven down not by the unique and unexpected events of Hurricane Katrina, but by his handling of the economy, foreign affairs and Iraq. That is much worse news than problems at FEMA, and cannot be easily cured with reconstruction programs for the Gulf coast.

Overall Job Approval, updated to 9/18.


Overall Presidential job approval, as of 9/18 Posted by Picasa

The lastest national polls have continued to report the lowest approval ratings of President Bush's administration. The graph adds three new polls, from CBS/NYT (9/9-13/05, App: 41, Disapp: 53), Fox/Opinion Dynamics (9/13-14/05, App: 41, Disap: 51), and Gallup (9/16-18/05, App: 40, Disapp: 58). The AP/Ipsos poll (9/16-18) appeared after I mdae the figure, but doesn't change the results: App: 40, Disapp: 57.

With these new polls added, my model of approval estimates a Katrina impact of -1.48, which is now solidly statistically significant. Alternative models produce estimates from -1.35 to -2.10.

I've also added a lowess (local regression) trend line (in red) to the plot, as suggested by Robert Chung (thanks!). You can easily see the shift in the local fit since Katrina hit. Robert has an excellent discussion of polling house effects here.

The interesting question will now become whether this Katrina impact will be short lived or if it will represent a permanent shift in the President's approval rating. More on that shortly.

Bush Katrina Job Rating Remains Stable (9/19)


Approval of President Bush's handling of Katrina, through 9/19. Posted by Picasa

Approval of President Bush's handling of Katrina has remained stable over the past week to 10 days, according to polling from ABC/WP, CBS/NYT, SurveyUSA, Gallup and AP/Ipsos. The local regression fit (lowess) plotted in red has stabilized and remained quite flat over the last several polls.

The good news for the President is that the initial decline has been arrested and slightly reversed from the low of approval, around Sept. 7. The bad news is that the President's speech on September 15 appears to have done little to improve the image of his performance.

Thursday, September 15, 2005

Post Katrina Job Approval of President Bush (as of 9/13)


Overall approval of President Bush's job as president, through 9/13 Posted by Picasa

Five polls have come in since the last update, so time to take another look at approval of President Bush, and the post-Katrina effect.

Gallup, Pew/PSRA and ABC/WashingtonPost were all in the field 9/8-11. The approval ratings are Gallup 46%, Pew 40% and ABC/WP 42%. That is unchanged for Pew since their 9/6-7 poll, and down 3 points from 45% approval in ABC/WP of 8/25-28, just before Katrina made landfall. Gallup, on the other hand, shows a 1% gain in approval from 8/28-30, partially after landfall but before the magnitude of the disaster was clear. See MysteryPollster.Com here for comments on the general downward trend in polls between July and now, along with a familiar looking graph.

The two latest polls are NBC/WSJ/Hart-MacInturff 9/9-12 and CBS/New York Times, 9/9-13, at 40% and 41% approval respectively. For NBC/WSJ that is a drop of 6%, from 46% in an elderly poll taken 7/8-11. For CBS/NYT the change is a drop of 1% from the CBS poll of 9/6-7.

So four of the five polls show declines, but from different baselines at different distance back in time.

We now have 14 post-Katrina polls for estimation. My analysis suggests an effect of Katrina of about -1%, once the negative trend since January and the effect of polling organization are taken into account. That estimate barely fails to reach statistical significance. The fact that 12 of the 14 post-Katrina polls fall below the simple trend line in the figure above, makes it clear that Katrina almost certainly has damaged President Bush's approval rating, but the effect does not appear especially large. The president has been losing .03% approval each DAY since January, in my model across all polling houses. That amounts to about 1% loss per month, or close to 8% since January. That the post-Katrina polls suggest a -1% impact amounts to an additional "month's" worth of lost support due to Katrina.

Tuesday, September 13, 2005

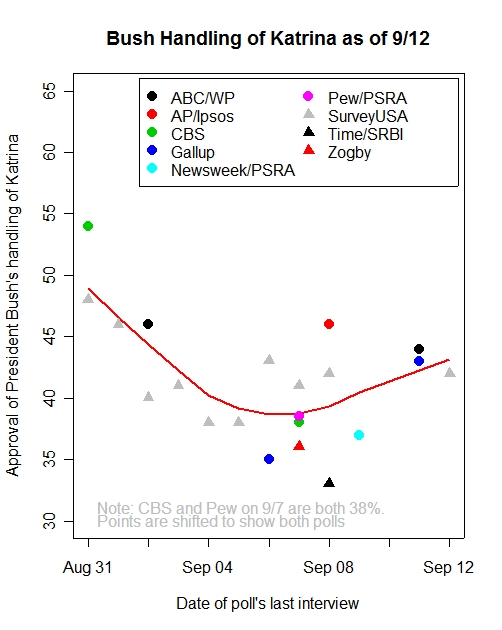
Bush Handling of Katrina, though Sept 12


Approval of President Bush's handling of hurricane Katrina situation, through September 12 polling. Posted by Picasa

Three new polls now suggest an improvement in the public's rating of President Bush's handing of the Hurricane Katrina situation. ABC/Washington Post, Gallup and SurveyUSA each show approval ratings over 42%, the best cluster of poll results for the President in several days.

The addition of these new polls produces a substantial uptick in the trend line of approval, shown in red in the graph above. However, this uptick may be an artifact of house effects. The two polls with comparable questions produce essentially no change.

The ABC/Washington Post result shows a slight decline in approval from 46% on 9/2 to 44% in the new poll taken 9/8-11. SurveyUSA poll, taken 9/12 holds steady at 42%, the same as on the previous SurveyUSA poll of 9/8

The Gallup result is for a different question than Gallup used in it's earlier survey of 9/5-6. In that earlier survey the question was "On a different topic: Do you think George W. Bush has done a great, good, neither good nor bad, bad, or terrible job in responding to the hurricane and subsequent flooding?" In the new survey, conducted 9/8-11 Gallup used it's more usual question: "Do you approve or disapprove of the way George W. Bush is handling the response to Hurricane Katrina?" Approval in the first survey ("great or good job") was only 35% compared to 43% in the new survey. However, the earlier question included a "neither good nor bad" category that drew 21% of the responses. So the conclusion is that the Gallup numbers are badly non-comparable, and no trend should be inferred from the two Gallup numbers alone. (If anyone knows of the more standard Gallup item on the earlier poll, please let me know. It wasn't in the original Gallup report.)

Monday, September 12, 2005

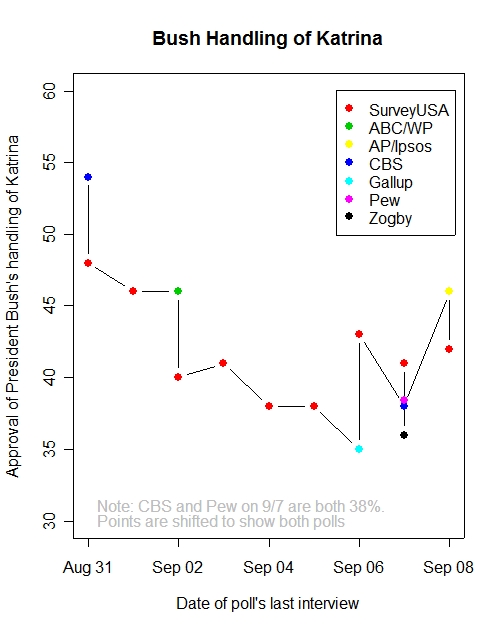
Bush Handling of Katrina, though Sept 9 (Corrected!)


Approval of President Bush's handling of the Katrina situation, through polls of September 9. The red line is an estimate of the trend in approval. Posted by Picasa

Two new polls on President Bush's handling of the aftermath of Hurricane Katrina suggest that opinion has held steady since September 5. The current estimate of the trend in opinion is that between 38% and 39% of the public approves of the President's performance.

This update adds two new polls, Time/SRBI (9/7-8) and Newsweek/PSRA (9/8-9). The Time poll registered a 33% approval while Newsweek found 37% approval.

The addition of these two polls, with two of the four lowest approvals recorded so far, reverses what appeared to be an improvement in evaluations of President Bush's handling of the Katrina situation. The AP/Ipsos poll of 9/6-8 found a 46% approval rating-- creating an overall upward trend in approval. (See the earlier graph here.) But with these two new polls, the red trend line is essentially flat since 9/5, with little sign of a real upturn.

The AP/Ipsos poll used a question wording somewhat different from other surveys, framing the question in terms of the "relief effort for the victims." MysteryPollster has a nice discussion of the possible impact of that question wording. In light of the more recent polls from Time/SRBI and Newsweek/PSRA, the AP/Ipsos question does look a bit higher.

Correction! In yesterday's post I relied on the Time Magazine website's description of the Time/SRBI survey. Rookie mistake on my part. The Time site described approval of President Bush as follows:

"President Bush Approval Rating: President Bush's overall approval rating has dropped to 42%, his lowest mark since taking office. And while 36% of respondents said they were satisfied with Bush's explanation of why the government was not able to provide relief to hurricane victims sooner, 57% said they were dissatisfied."

I used that 36% satisfied with Bush's explanation as a measure of approval of his job handing the hurricane situation, assuming incorrectly that this was Time's measure of Bush's handling of Katrina. But today SRBI has posted the full text of the survey, in which appears a standard job approval question, as well as the "satisfied with Bush's explanation" question. For the record the question texts and results are:

Q7. How would you rate the job that each of the following has done in responding to the hurricane and the destruction it caused? A. President Bush

Excellent/Good (net) 33%
Fair/Poor (net) 65%
Don't Know/NA 2%
Q9. How satisfied are you with the President's explanation of why the government was not able to provide relief to hurricane victims sooner?

Very/Somewhat Satisfied 36%
Somewhat/Very Dissatisfied 57%
No answer 7%

I've now replaced the Time/SBRI item in the graph with the correct data from Q7, which is similar to the question wording used by most surveys, rather than the less common question in Q9. The basic picture doesn't change, though the Time/SRBI Katrina job approval is even lower than I thought. The flat trend in approval since 9/5 is not affected by this.

I've also removed yesterday's original post. Not to hide mistakes (see above!) but to avoid having a misleading graph and comment on the site. No doubt this will be the last mistake I have to correct! <;-) (NOT too likely.)

Sunday, September 11, 2005

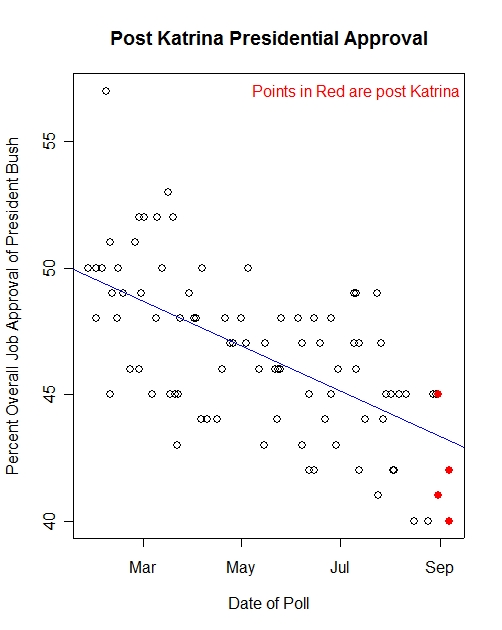
Post-Katrina Approval of President Bush (updated 9/11)


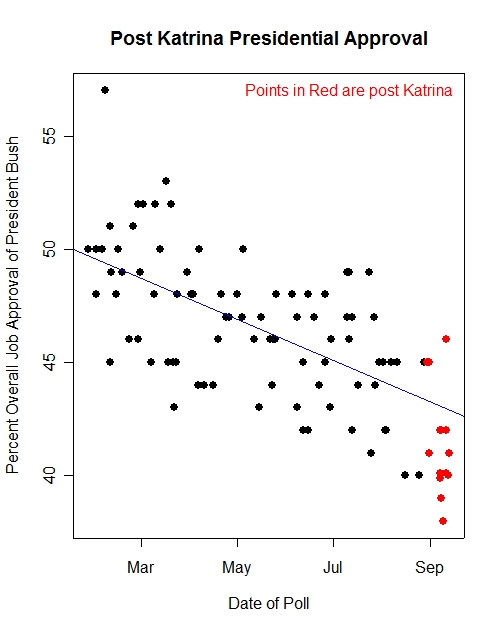
Bush job approval in all public polls taken since 1/20/2005. Red points are post-Katrina. The blue line is the trend in approval of President Bush since January 20, but before Katrina struck. Note there are two post-Katrina polls at 42% taken 1 day apart, so the two points are easily mistaken for one.Posted by Picasa

President Bush's approval ratings continued to decline in new polls taken towards the end of last week. The AP/Ipsos poll found an approval rating of 39% in interviews taken 9/6-8. Time/SRBI recorded a 42% approval over 9/7-8, while Newsweek/PSRA found a 38% approval level in its 9/8-9 survey.

In all three cases, the approval ratings are the lowest ever recorded for President Bush by the particular poll.

The direct impact of Hurricane Katrina, as opposed to the general downward trend in President Bush's approval, is not yet statistically precise. I estimate an effect of between -1.2% and -2.o% due to Katrina, after accounting for the general negative trend, and after accounting for differences between polling organizations. However, the number of post-Katrina polls is still not large enough to have great confidence in these estimates.

Saturday, September 10, 2005

Latest Bush-Katrina Approval


Update on approval of Bush's handling of Katrina. Posted by Picasa

The two latest poll results (through 9/8) suggest that approval of President Bush's handling of the Katrina aftermath has begun to rise. The AP-Ipsos poll, taken 9/6-8, shows approval of Bush's "handling the relief effort for victims of Hurricane Katrina" at 46%, with 52% disapproving. While not so good on balance, this is the highest approval of his handling of the relief effort since September 2. A SurveyUSA tracking poll of 1200 respondents taken on 9/8 found approval at 42%.

Interestingly, the AP/Ipsos poll found that the Presidents overall job approval fell to 39%, a new low for his presidency in the AP/Ipsos readings. More on that shortly.

Friday, September 09, 2005

Post-Katrina Overall Job Approval for President Bush


Post-Katrina Overall Job Approval for President Bush Posted by Picasa

An earlier post (here) presented data on public approval of President Bush's handling of the Hurricane Katrina situation. There the data show a clear decline in the President's rating over the past 9 days.

But what about his overall rating as president? The polling is only beginning to trickle in on that question, but here are the early returns. There have only been five post-Katrina readings of overall job approval. The first two, by CBS and Fox, completed interviews on 9/31, the first day after Katrina hit, so provide an important measure of initial reactions. CBS found a 41% approval rate, while Fox's was 45%. The three polls since then, by Pew, Zogby and CBS all finished interviewing on 9/7. Their approval numbers are 40, 40 and 42 respectively.

Both Zogby and Pew show significant drops, from 45% and 44% approval in their previous polls. However, those previous polls were taken way back in July. August was not a good month for the President's polls, so attributing all the decline to Katrina is a significant overstatement.

The CBS polls, taken 8/29-31 and 9/6-7, provide the best "before (well, early at least) and after" comparison. In this case, Bush's approval actually rises from 41 to 42%.

We can push the results a little more.

In the figure, I plot the 89 national polls taken since President Bush's second inauguration. It is clear that during this time, approval has fallen in a basically linear fashion, dropping at the same rate from January through August. There is also considerable variation across polls, much (though far from all!) due to differences between polling companies. So to estimate the effect of Katrina on approval, we should account both for the linear trend, and for "house" effects between different companies.

When we do that, the result is an estimate of -.52 for the post-Katrina effect, a decline of about a half a percentage point in approval. With the few polls and modest effect, this is far from statistically significant (p=.61).

The moral is that, if there is a decline in the president's overal job approval, it appears modest, though the data we have so far will support no firm conclusion of any change at all. No doubt there will be a flood of new data in the next week, providing more leverage for this estimate.