Presidential Approval, January-October 13, 2005.

Two views of President Bush's job approval ratings come from the recent flurry of new polls. The first focuses on recent events. I've been calling these "Post-Katrina" but perhaps should now call them "Post-Harriet".
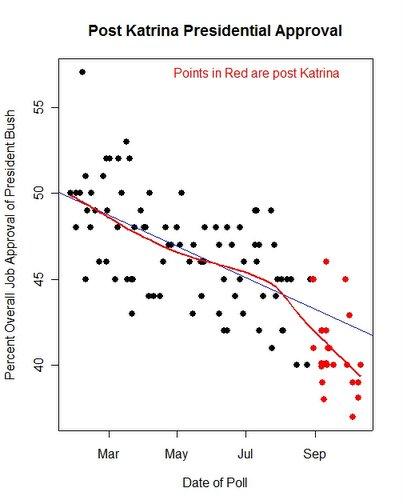
This first graph shows the new results with a total of 26 post-Katrina polls (in red). The decline in the President's approval is clear visually, and the local trend line in red shows how sharply the trend has departed from the blue linear trend for PRE-Katrina polls. (Note the close fit of red and blue trends before August.)
The model, corrected for differences among polling houses, now estimates a Katrina effect of -1.2%. Prior to Katrina, approval was falling at a rate of -.03% per day throughout 2005. So the post-Katrina drop is equivalent to 40 days of pre-Katrina trend.
This will be the last estimate I give of the "Katrina" impact. I believe events have now moved on, so attributing any further change to Katrina, is probably a confounding of effects. The estimate of that effect has remained stable at between -1.1 and -1.3 for a while now, so I'm satisfied with this estimate.
The bottom line: the President's approval has fallen all year, declining about 1% every month since January. But since August we've seen a sharper drop. One important remaining question is whether the rate of decline has also increased, after we take account of the immediate Katrina effect. So far that can't be estimated because it is confounded with Katrina. But the next month should give us the data for an answer.
The next graph takes the long view of the entire Bush administration. Due to a change in Blogger that I can't seem to circumvent, this graph and comments appear in the next post, rather than right here, as I might wish. My HTML skills aren't what they might be.