 SurveyUSA has new 50 state approval ratings that are quite interesting. The data at their site are here.
SurveyUSA uses automated polling that is open to question by most survey research standards. MysteryPollster.com has discussed the methodological issues here and here. I think the validity of their polling is an empirical question, and by and large their results appear to track well with conventional surveys. Perhaps I'll post on this later, but for now, let's take their results at face value. And you'll see below a very nice match between their results and national surveys using conventional methods.
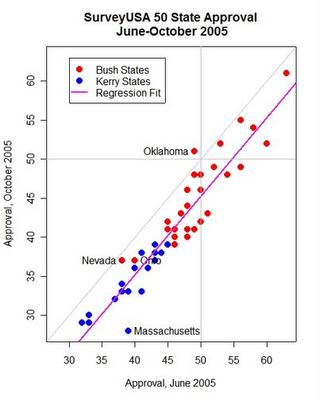
My graph compares President Bush's approval in June (before either the Vacation with Cindy Sheehan or Katrina or Harriet) and his rating in October. (SurveyUSA took the October poll 10/14-16/2005, with 600 respondents in each state. The June survey was 6/10-13/2005, also with 600 interviews per state.)
What is interesting is the uniform drop in approval of President Bush across the states. The regression fit (the purple line in the figure) is OctApprove = -5.130 + 1.0086*JuneApprove. You can fiddle with adding differences between Bush states and Kerry states, but the difference is quite small. After trying several specifications, I think the simplest model with across the board decline is the best. (See Philip Klinkner's comments at PolySigh for a somewhat different view.) While there is an obvious relationship between states won by Bush and approval levels, the critical fact is that ALL states (except Oklahoma) show a shift downward, below the diagonal line in the figure, representing stable approval levels.)
So the conclusion is a little over a 5% decline in approval between June and October that crossed partisan state lines. Given the year-long decline of -.03% per day reported in my previous posts, the trend would account for -3.75% of this decline (125 days x -.03 per day), with the post-Katrina shock taking the remaining -1.38% change. This is very close to the estimates based on national polling reported here, of -1.3472 (after adding the latest Gallup poll into the data. It was -1.2% before the October Gallup data came in.)
So what is to be said? The President's problems are very widespread. This is not a "Blue State versus Red State" phenomenon. Instead, the President is suffering equally everywhere. The causes of the decline are widely reported, though poorly documented. We all cite gas prices, the war in Iraq, Katrina and so on. There is little empirical evidence for which of these (or other) variables are really driving approval ratings down. Regardless, this is a presidency in trouble across the board.
Of particular political relevance are the Red states in the figure that are below 50% approval in BOTH June and October. There are sixteen (16!) states that Bush carried in 2004 but in which fewer than half the adults approve of his handling of his job in either June or October. The midterm election is fast approaching. These are not encouraging signs for Republican candidates, or (especially) potential candidates. Don't count on the Democrats to produce a coherent and winning platform, but Republicans must fear self-inflicted wounds that criple them even against a poorly organized opposition. Should the Democrats put together a coherent critique AND positive proposals for change, this could be a devastating midterm for the hoped-for long term Republican Majority we heard so much about in January and February. If Clinton squandered his second term with Monica, Bush may also be losing his chance to create an enduring partisan legacy for his party and for the conservative movement. The "political capital" of January appears to have been spent, and then some.
