Thursday, April 27, 2006

Bush approval at 36% in NBC/WSJ poll


The NBC/Wall Street Journal poll provides "less bad" news for the White House today in the form of a 36% approval, 57% disapproval rating of President Bush. The poll, taken 4/21-24/06, is 4 percentage points above the 32% approval registered in the new CNN/ORC poll completed 4/23. On the other hand, this is a "new low" for NBC/WSJ polling, which has declined steadily from 39% to 37% to now 36% since late January. The low for 2005 was 38% in early November.

The NBC/WSJ is, however, a percentage point above my current trend estimate of 34.96% approval. That's well within the usual range of variation. NBC/WSJ has a house effect of -.7%, so it is a little unusual for them to be above the overall trend. With a margin of error of 3% this isn't unlikely enough to provide evidence for a change in trend. I'm still betting new polls will come in close to 35%.


Click here to go to Table of Contents

Tuesday, April 25, 2006

House Effects and Presidential Approval


Updated with polls through 8/9/06 See bottom of the post for the latest estimates and confidence intervals. The graph above is also updated through the latest polls.

I've often posted on "house effects", the tendency of polling organizations to systematically vary in their results from one another. It seems time to consolodate that information into a single post, rather than as part of a post on something else. So here is a post that will become the standard spot for current estimates of house effects.

The graph above plots the house effects for presidential approval for all pollsters in 2005-2006.

The house effects measure how far polls by a firm are from what would be predicted based on trends over time for the average firm. In other words, the average house effect is set to zero by design. A poll that is consistently 2% below what would be predicted for the date the poll was conducted will have a house effect of -2.0%. This model accounts for trends in presidential approval over time and for events, such as Katrina, that shock approval up or down.

The confidence interval in the plot represents the margin of error for the estimated house effect. That margin is wider for organizations that do fewer polls and also reflects variability in results for the house. The very wide margins for CNN/ORC, LATimes and Annenberg are due to those polls conducting only a single poll during the 2005-06 period. CNN/ORC in particular will shrink the confidence interval as more polls accumulate. LATimes has now partnered with Bloomberg so I'm developing estimates of their house effects separately from the old LATimes estimate.

These estimates are specific to the presidential approval question as posed by each organization. We would get different house effects for different questions, such as party identification. I may add house effects estimates for some of those other items later.

House effects are usually pretty stable over time, but I'll update this as more polls accumulate.

Here are the estimated house effects as of polling completed by 4/23/06. (Note that since CNN/ORC only have one poll, the confidence interval is very wide and the estimate below will certainly change with more data.)

CNN/ORC -2.92
Quinnipiac -2.72
Pew -2.32
Newsweek -2.19
Harris -2.09
CBS/NYT -1.88
AP -1.86
Zogby -1.14
NBC/WSJ -0.90
LATimes -0.55
Marist 0.20
Time 0.42
Fox 0.72
Gallup 0.81
LATimesBloomberg 0.84
ABC/WP 1.30
Cook 1.48
Greenberg 1.82
Hotline 1.89
NPR 2.01
Annenberg 2.42
Battleground 4.65

For another look at house effects see the superb graphs and discussion by Robert Chung here and also here.

UPDATE 4/27/06: Here are the current estimates with confidence intervals, for polls completed through 4/24/06. There is a small shift for NBC/WSJ due to its new poll. That estimates shifts from -.90 to -.73. Note that these are 90% confidence intervals.


Update: 8/12/2006: I've updated the estimates of house effects to reflect new polling in 2006. The table of new estimates and the confidence intervals appears below.


Click here to go to Table of Contents

Bush Approval in CNN at 32%


The new CNN/Opinion Research Corporation (no longer Gallup) poll taken 4/21-23/06 finds approval of President Bush has slumped to another new low, this time 32% approval and 60% disapproval. There is also a rather large "Don't know" rate of 8%. (The median DK rate in 2006 across all polls has been 4%, though 17% of 2006 polls prior to this one have seen DK at 8% or higher (11 of 63 polls). This result is similar to Fox's recent result of 33% in a poll completed 4/19, though both are a bit below recent Pew and Gallup results of 35 and 36% respectively, and well below the LATimes/Bloomberg rating of 39% from their 4/8-11 polls. CNN reports that ARG found 34% approval in a poll completed last "Tuesday through Friday".

Based on the new data, my trend estimate is now at 35.05, down from 35.9. When the Fox poll arrived, I said here that I expected it would prove a bit low and that based on the model, approval around 35% was more likely in upcoming polls. While Pew is at that level, the Fox and ARG results are below it and the new CNN is even more below. There is still reason to think that approval is "really" about 35% (the "reason" is my trend estimate!) but there is also room to wonder if Fox and CNN are harbingers of a new sharp dip in approval rating.

There is also an important caution. This is the first CNN poll conducted by Opinion Research Corporation. CNN and Gallup ended their relationship last month (Gallup's last CNN poll was 3/10-12). [MysteryPollster Mark Blumenthal has an excellent discussion of this here.] ORC is a well established polling organization but we do not have a public track record for their presidential approval results. Their "house effect" is therefore completely unknown. It may be they tend to get approval numbers that are higher, lower or about average compared to other polling organizations, we simply don't know. Until they produce a number of approval polls, we won't be able to say much about this. Yet that fact is critically important to know before we make too much of the 32% result in this latest poll. If they have an "average" house effect, then this is bad news. If they have an above average effect, then this is terrible news for the White House because others will be even lower. But if they tend to under-state approval, then other polls will probably come in higher. The gap between my 35% estimate and their 32% is (just) within the margin of error for the CNN poll, so it doesn't fall outside a reasonable range of the trend.

The only relevant data I've been able to find for ORC is not presidential approval but rather party identification. A September 2005 ORC poll found 27% Rep, 27% Dem and 35% Ind, with 11% don't know or other. Those are somewhat low partisan percentages compared to other polls. Their party id question is also somewhat different from what other organizations typically use:

"
How would you describe your personal views? Are you...Republican, Democrat, or Independent?"

It would appear from the 11% DK and other that they don't push respondents to choose a partisan category, which many surveys do. Those results would put ORC close to NBC/Wall Street Journal in terms of finding lower percentages of both partisan camps than most polls. The equality between Republicans and Democrats also makes ORC a little unusual since the large majority of polls in 2005 and 2006 have found a small Democratic advantage over Republican identification. See here for all the details of party id across polls.

As I showed in this earlier post, modest variation in party id does not have a huge effect on approval ratings, certainly not as large as seems commonly believed. Further, we only have this single ORC poll in 2005 as a point of comparison, so it is important not to make too much of this. When ORC has completed a dozen or so polls for CNN we should have a good statistical handle on what their house effects look like in comparison with other organizations.

But do let me rant briefly. CNN has changed polling houses. Yet their web site posts comparisons with past Gallup polls (see here.) How can we compare ORC with Gallup if more information is not provided? I was able to find only ONE previous ORC party ID result from the past 16 months (and that using the Roper Center's subscription only service.) As I said above that question wording is a bit unusual. What PID wording is used for CNN? Is it the same or different? They don't say and don't provide the results. It is inexcusable that CNN refuses to post the demographic and especially partisan breakdowns of their polls. While they deserve some commendation for including the topline results of their topical questions, they need to follow the lead of other reputable polling organizations and provide us with the full demographic breakdowns as well. It costs nothing and it enhances credibility. It would also allow some assessment of how ORC compares with Gallup and with other organizations. If CNN's business is information, they should be concerned to provide enough of it for resonable understanding of their results.

Click here to go to Table of Contents

Friday, April 21, 2006

Censure and Progressive Patriot Contributions, pt 2


In my previous post on monthly FEC reports by Russ Feingold's Progressive Patriots Fund, we saw that there was a sharp increase in March contributions. Feingold's censure proposal was announced on March 12, a third of the way through the month. While I think the monthly data make a strong case for the impact of the censure proposal on fundraising, we can look at things more closely by switching to the individual itemized contributions, which are available daily. These are contributions over $200, or contributions by an individual who has contributed a total of more than $200 in the year. I'll call these "large" contributions despite the potential inaccuracy.

The figure above shows convincingly that the spike in contributors coincided with the week Feingold proposed censuring President Bush. Because we can't get daily data on "small" contributors under $200, this is the best available evidence that the censure proposal was indeed the motivating factor in contributions. I speculate that the surge in "small" donors was probably even greater, given both ease of contributing through the website and the small barrier of an under $200 contribution. Those most unhappy with President Bush and looking for a Democratic leader found one in Sen. Feingold.

The next figure shows the total amount contributed by these itemized donors.


Here the effect is also sharp, but the peak falls in each of the two weeks after the proposal. By the last week of March, total "large" contributions had fallen back to only a bit above the rate of January and February. Yet the number of contributors mobilized was still relatively high. Why? Sinking average contributions. (Which must be if N is up and Total is down: Avg=Total/N, after all!)


The average contribution surged only modestly in the week of the cenure proposal, and fell back to among the lowest levels of the Progressive Patriots Fund's short history. Of course this isn't necessarily a bad thing. The evidence from our monthly data is that there was a massive surge in small contributions, hitting $186,457 in March, up from $81,910 in February and $30,700 in January. Itemized larger contributions amounted to $95,667 in March, up from $22,750 in February and $38,750 in January.

Presumably the above graphs reflect the success of the Progressive Patriots Fund in attracting more donors who are able to give over $200 but not multi-thousand dollar contributions. These donors may be more valuable in the long run if their lower contributions can be repeated multiple times. (To digress, a Stevens Point WI woman appears to hold the record for number of discrete contributions to Howard Dean in 2003-04: 63. Hat tip to UW grad student Ben Sayre whose research produced this wonderful factoid.) And once donors are identified they can also be plugged into the Feingold machine for non-monetary activities, should there be need for such in the future.

So I think we can close the books on the question of the impact of the censure proposal on fundraising. The spike is strong and perfectly coincides with the week of the censure proposal. The Progressive Patriot Fund benefited in aggregate dollars and especially in identified supporters. And not to forget Dean's 2003 money machine-- many small donors can add up to some serious money. It appears Feingold has tapped them very successfully since March 12.


Click here to go to Table of Contents

Thursday, April 20, 2006

Feingold's Progressive Patriots contributions spike


Russ Feingold's Progressive Patriots Fund has seen a substantial spike in contributions in March, following Feingold's call for a censure of President Bush on March 12. The increase in contributions was especially large for non-itemized individual contributions, those less than $200 (and less that a yearly total of $200 for the individual donor.) I speculate that much of this is from web-based receipts, but it could be from checks in the mail as well.

The Progressive Patriots fund relied primarily on larger contributions (almost all itemized) through the first thee quarters of 2005. In the last quarter non-itemized contributions rose to an average of $25,000 per month. (I'm unclear whether the late 2005 spike in itemized contributions, especially in December, was the result of reporting small donors who went over the $200 total requirement late in the year, or was a genuine spike in larger donations. This might be a bit of an artifact because of that.)

In any case the January totals were not markedly increased but February saw a doubling of non-itemized small donations and these doubled again in March. Smaller donations outpaced itemized donations for the first time in February and by a still wider margin in March.

Of course, this is probably also the result of ramping up the Progressive Patriots web site, but the timing of the censure proposal is hard to ignore in the March surge.

Feingold got a pretty bad reaction from congressional Democrats after his censure proposal, but it bought him the two things lesser-known potential presidential candidates need most: money and visibility. If President Bush's approval ratings remain where they are now, or fall further, for the next 20 months or so, the censure call may well be a prescient move.


Fred Frommer of the AP wrote this story
which stimulated me to look at the data. Earlier Frommer wrote this piece on reaction among Democratic voters compared to members of congress.


Click here to go to Table of Contents

Approval declines: Fox 33, Harris 35, Pew 35, All below trend


Three new polls. The shock is that all three are below the current trend. As of yesterday the trend was 37.0%. Today's results: Fox 33%, Harris 35%, Pew 35%. Finding all three below the previous trend is striking. The new trend estimate is pulled down to 35.9% approval.

The Harris poll was taken 4/7-10/06, properly in an earlier set of polls. That reading is 35% approve, 63% disapprove. (This just appeared on PollingReport.Com. I'm not clear what accounts for the delay between field period and release of the data.) This represents a 1 percent decline in approval from early March and an 8% decline since early January.

The Pew poll was taken 4/7-16/06 and finds approval at 35%, disapproval at 55%. That is a 2% INcrease since their 3/8-12 poll, and a 3% decline from early January.

The Fox poll was conducted 4/18-19/06 and registers 33% approval and 57% disapproval. The previous low for Fox was 36% (both 4/4-5/06 and 11/8-9/05). The Fox approval reading is down 9% since early January.

My local trend estimate with these polls included is 35.9. Yesterday without them it was 37.0. That large a change is due to all three agreeing that approval is below the previous estimate, though the low Fox value also drags it down. The Fox poll is both the most recent and with a 2 day field period, short compared to Pew's 10 days of interviewing. Compare this with Gallup's 36% in their 4/10-13 poll. Both Fox and Gallup have small positive house effects, +.66 for Gallup and +.57 for Fox, so there is little difference between these two due to that. The implication is a 3% decline in approval over the week from 4/13 to 4/19. That seems high to me. While the president's approval ratings do seem to continue to decline, that is a much higher rate than what we've seen since February. (The rate since February, including these polls, is -.11% per day, or 1% each 9 days.) So either something bad has happened to generate the new, sharp decline for Fox, or this is an unusual poll and will probably rebound in the next Fox reading. Given the trend estimate of 35.9, I'd expect to see some improvement in the next Fox poll, but readings that are in the ball park of 35% in the next round of polls in a week or so.

One has to imagine that new White House Chief of Staff Joshua Bolten is asking himself what can be done to halt this slide that is well on its way to destroying the president's second term. From the happy talk of a new "Republican Majority" following the 2004 elections, we've seen Republican partisanship in the electorate decline over the past 15 months (see here if you must), policy initiatives of some daring fail even with Republicans, and a lack luster State of the Union which seems now largely irrelevant. A successful immigration bill that includes a clear presidential win on guest workers and a path to citizenship, coupled with tough border enforcement, seems the best chance for the White House to improve it's condition (and appears supported by the polling data as acceptable to the public). Such a compromise would require successful presidential leadership, and such a success would be the best news in a long time for the administration. But can they do it?


Click here to go to Table of Contents

Wednesday, April 19, 2006

Current approval estimate at 37%, Gallup at 36%


The latest Gallup poll, 4/10-13/06, finds approval at 36%, disapproval at 59%. My local trend estimate (blue line in the figure above) is 37.0% approval. The flattening of approval around 37% has continued for the last 30 days, since mid-March. Gallup has had steady readings of 36, 37, 37 and 36 since 3/10-12.

The SurveyUSA 50 state tracking poll for 4/7-9/06 has a national estimate of 36%. I don't include SurveyUSA in my national approval tracking, but it is of interest to compare it with conventional telephone polls as a means of assessing the reliability of the SurveyUSA data gathered from "robo-callers", recorded voices with respondents pushing phone buttons to respond. I'll be doing some more systematic checks on their data soon.

After the flurry of early April polls, the volume of polling has fallen off considerably. I continue to think it makes better business sense to spread the polling across the month so as not to conflict with other polls from early in the month. If everyone polls early in the month they step on each other's stories AND we get a poorer picture of how approval changes over time because we have few polls from later in the month.

Click here to go to Table of Contents

Senate Races and Presidential Approval in the States


(Click on figure for a larger view.)

President Bush's approval ratings have fallen over the past 12 months in all the states, though from different starting points and at somewhat different rates. For tossup and close Senate seats, these trends tend to favor the Democrats on balance. The state trends in Pennsylvania and Rhode Island are particularly unfavorable to Republicans, though Maine's Olympia Snowe seems untroubled by equally bad presidential trends.

In the graph above, the horizontal axis is my estimate of state level approval of President Bush in May of 2005, based on SurveyUSA's 50 state tracking poll. (See my previous post on these trends here for background and trends within states.) This estimate is based on the entire 12 months of data from the state, so my "estimated approval" does not exactly match SurveyUSA's poll results. The linear trend in approval is plotted on the vertical axis. This is the estimated percentage point decline PER MONTH in approval of the president. You can mentally multiply this by 12 to get the estimated decline over the past year. For example California has decline rate of -.6 so this implies a year-long drop of -7.2%.

I should add that MANY of these state differences are not statistically different from one another, so this plot should be taken with a substantial lump of salt. If we said all states declined at a -.59% per month rate, we wouldn't be far wrong. (-.59 is the estimated rate of decline using all states and forcing them all to have the same rate of decline. One cannot reject this common rate of decline using a standard fixed-effects model.) Nonetheless I'll treat these differences as at least somewhat indicative of state trends (and risk the potential error.)

The Senate seat ratings are taken from the Cook Political Report for March 31
. I've called his "Solid" and "Likely" races as "safe" here. "Tossup" and "Leans" are the same as Cook's categories.

The unambiguously good region for the Republicans is the top right quadrant. These states are above the average May 2005 approval rate (45.3%) and have declined in approval at a slower rate than other states. (Again, be careful-- as you come close to the center none of these differences are statistically significant.) Four safe Republican Senate seats are here: UT, MS , AZ and VA. One Democratic seat, WV, is also in this quadrant (barely). Likewise the tossup seat in TN is near the center but in this quadrant. That isn't great news for TN Republicans, but it certainly beats being in the lower left quadrant.

The lower left quadrant is unambiguously good for Democrats. States here are below average in initial presidential approval AND have declined at a greater than average rate over the past year. Here two Republican Senate seats in PA and RI are tossups and in unfavorable conditions. (They are also in "blue" presidential states, indicated by the outer color of the point.) Maine's Snowe is also here, but she seems immune from the force of presidential approval. What is good news for the Democrats here are the "leaning" races in NJ, MD and MI. The national forces are working to reinforce the Democratic campaigns in these three important states. MN is a tossup open-Dem race with average initial approval but somewhat stronger than average decline in approval. As with Tennessee, that ain't great, but better for the Dems than if this state were up and to the right.

The ambiguous quadrants are top left--- below average initial approval but slower rate of decline--- and the bottom right--- above average initially but with faster decline. The VT and WA races Lean Dem in the top left. VT has some of the lowest approval ratings in the country, so that favors the Dems. WA is closer to the center, not so far from the average state. The Republican tossup in Missouri is also very close to the center, as is Florida's seemingly safe Democratic seat. Ohio's tossup also suffers from the low initial approval but the state Republican party troubles probably matter more there.

The bottom right quadrant suggests added problems in Montana which is already a tossup. While approval started at a well above average 54%, it has fallen at one of the two fastest rates in the country and now stands at only 40% as of April. The Nebraska "leans-Dem" seat is more ambiguous with closer to average decline and a higher initial approval rating. Nebraska is one of only four states with approval still above 50%. Other races in this quadrant appear safe regardless of party.

Of the tossup races, PA and RI clearly face strong anti-Republican national forces. I'd add MT even though that state is in the lower right quadrand. MT has fallen to the 17th most supportive state for President Bush, but with only a 40% approval rating in SurveyUSA's April poll. That rate of decline seems to bode ill for Republican candidates.

The tossups in MO, TN and MN are all closer to the average across the country, neither particularly helped or hurt by national forces relative to other states. (Of course, the overall level of presidential approval is a national drag on the Republican's right now, so this isn't to say they are helped by national forces, just not hurt more than average.) The Ohio tossup has a lower than average decline, but still OH has a slightly below average 34% Bush approval rating, on top of the local troubles.

Of the "leaning-Dem" races, NJ, MD and MI seem to clearly benefit from national forces, and I would add VT. WA is close to average (current approval 38%, slightly above the national average of 36% in the SUSA April poll.) Only Nelson's Nebraska seat leans Dem into the face of national winds.

The Democrats look fairly good in their "leaning" races. Of the tossups, Republicans have more disadvantages than advantages with RI, PA, MN and MT looking worst. TN, MO and OH relatively better but not great. But these are national forces-- as always, the local race and the local candidates will have a lot to say about the final outcomes (not to mention the local voters!)

Control of the Senate looks like it could be a close thing. Dems have more exposure but Reps have more tossups and generally less favorable state trends. Stay tuned.

Data: The Cook Political Report here provides ratings of all Senate Races. The 50 state presidential approval data is from SurveyUSA here. They generously provide free access to their unique approval data at the state level. The sponsors of these surveys, listed below, are the ultimate reason we have these data. Thanks.

Click here to go to Table of Contents

Alabama WKRG-TV
Alaska SurveyUSA
Arizona KPNX-TV
Arkansas KTHV-TV
California KABC-TV KPIX-TV KXTV-TV KGTV-TV
Colorado KUSA-TV
Connecticut WABC-TV
Delaware WCAU-TV
Florida WFOR-TV WPTV-TV WFLA-TV WTLV-TV WKRG-TV
Georgia WXIA-TV WTLV-TV
Hawaii KHON-TV
Idaho SurveyUSA
Illinois KSDK-TV
Indiana WXIN-TV WHAS-TV WCPO-TV
Iowa KAAL-TV
Kansas KWCH-TV
Kentucky WHAS-TV WCPO-TV
Louisiana SurveyUSA
Maine WCSH-TV WLBZ-TV
Maryland WMAR-TV WUSA-TV
Massachusetts WBZ-TV
Michigan WDIV-TV WZZM-TV
Minnesota KSTP-TV WDIO-TV KSAX-TV KAAL-TV
Mississippi SurveyUSA
Missouri KSDK-TV
Montana SurveyUSA
Nebraska SurveyUSA
Nevada KVBC-TV
New Hampshire WBZ-TV
New Jersey WABC-TV WCAU-TV
New Mexico KOB-TV
New York WABC-TV WNYT-TV WGRZ-TV WHEC-TV
North Carolina WTVD-TV WFMY-TV
North Dakota SurveyUSA
Ohio WKYC-TV WYTV-TV WCPO-TV
Oklahoma KFOR-TV
Oregon KATU-TV
Pennsylvania WCAU-TV
Rhode Island WLNE-TV
South Carolina WCSC-TV WLTX-TV
South Dakota SurveyUSA
Tennessee WBIR-TV
Texas WOAI-TV KEYE-TV
Utah KSL-TV
Vermont SurveyUSA
Virginia WUSA-TV WDBJ-TV
Washington KING-TV KATU-TV
West Virginia WUSA-TV
Wisconsin WDIO-TV
Wyoming SurveyUSA

Tuesday, April 18, 2006

Bush approval in the 50 states from SurveyUSA


(Click on the figure, and click again for best resolution.)

UPDATED: The graph has been updated to include the April 2006 data released today by SurveyUSA.


An article by Richard Morin in yesterday's Washington Post presented evidence that approval of President Bush has fallen considerably in "red" states. Jay Cost at RealClearPolitics has written a nice critique of the Morin article, pointing out that Morin is aggregating across states rather than looking at individual states and that his sample size is probably quite small in important cases. Both pieces are well worth reading.

The problem for Morin is that we want to know about state level approval but national polls are ill suited to such estimation. Morin uses only the latest Washington Post poll, divides the sample into residents of strong Bush, close Bush, close Kerry and strong Kerry states and presents his results for these categories of state. As Cost points out, some of these categories have few cases in a national sample, and the large margin of error that results makes his conclusions statistically shaky.

But there is an alternative: SurveyUSA has been doing monthly polling in each of the 50 states since May 2005. Each state has 600 respondents each month, making the small "n" problem go away. SurveyUSA uses a conventional sampling frame for random digit dialing, so their initial selection of numbers should be as good as any telephone poll. But SurveyUSA then uses a recorded voice to ask questions and respondents must enter responses by pushing the buttons on their phone. This method is viewed with deep skepticism by the conventional polling industry. To SurveyUSA's credit, they have published response rates on their website and provided analysis that addresses the concern that automated surveys produce such low response rates as to be unreliable. This isn't all there is to the problem of validating their methodology, but SurveyUSA has been more open about the issues, and has provided better data, than virtually all other survey houses, whether conventional or automated calling.

But the bottom line is that if you want to ask what has been happening in the states over the past year, SurveyUSA is the only game in town. The Morin and Cost pieces have pushed me to go with this post a little sooner than I had planned, and I think it is important that we examine the SurveyUSA data closely. However, the data have the advantage of consistent methodology over time and consistent sample size across states. They also pass the "inter-ocular" test-- the low approval states and the high approval states all "look right".

Read the figure from the lower-left to the upper-right to see approval from the lowest to highest. Look at the trends within and across states to see what has been happening over this time.

Some trends are stronger than others. Of the "red" states, the trend is bad news for President Bush in places like KY, NC, SC and NE. Others are quite stable: AL, MS, OK. The trend is down somewhat in more places than not, and that includes some but not all of the "red" states. I'll leave it as an exercise to the reader to count which states are down and which not.

Be careful of the scale: Nationally over this period, approval has only moved some 10-15%. The gray background grids are divided into 15% intervals, so that gives you a good sense of the scale of the change.


Click here to go to Table of Contents

Data: These data are provided by SurveyUSA on their website here. SurveyUSA deserves thanks for making this information widely available. The sponsors of the survey in the states also deserve acknowledgement, which follows below.

Alabama WKRG-TV
Alaska SurveyUSA
Arizona KPNX-TV
Arkansas KTHV-TV
California KABC-TV KPIX-TV KXTV-TV KGTV-TV
Colorado KUSA-TV
Connecticut WABC-TV
Delaware WCAU-TV
Florida WFOR-TV WPTV-TV WFLA-TV WTLV-TV WKRG-TV
Georgia WXIA-TV WTLV-TV
Hawaii KHON-TV
Idaho SurveyUSA
Illinois KSDK-TV
Indiana WXIN-TV WHAS-TV WCPO-TV
Iowa KAAL-TV
Kansas KWCH-TV
Kentucky WHAS-TV WCPO-TV
Louisiana SurveyUSA
Maine WCSH-TV WLBZ-TV
Maryland WMAR-TV WUSA-TV
Massachusetts WBZ-TV
Michigan WDIV-TV WZZM-TV
Minnesota KSTP-TV WDIO-TV KSAX-TV KAAL-TV
Mississippi SurveyUSA
Missouri KSDK-TV
Montana SurveyUSA
Nebraska SurveyUSA
Nevada KVBC-TV
New Hampshire WBZ-TV
New Jersey WABC-TV WCAU-TV
New Mexico KOB-TV
New York WABC-TV WNYT-TV WGRZ-TV WHEC-TV
North Carolina WTVD-TV WFMY-TV
North Dakota SurveyUSA
Ohio WKYC-TV WYTV-TV WCPO-TV
Oklahoma KFOR-TV
Oregon KATU-TV
Pennsylvania WCAU-TV
Rhode Island WLNE-TV
South Carolina WCSC-TV WLTX-TV
South Dakota SurveyUSA
Tennessee WBIR-TV
Texas WOAI-TV KEYE-TV
Utah KSL-TV
Vermont SurveyUSA
Virginia WUSA-TV WDBJ-TV
Washington KING-TV KATU-TV
West Virginia WUSA-TV
Wisconsin WDIO-TV
Wyoming SurveyUSA

Thursday, April 13, 2006

LATimes: Approval at 39%


The Los Angeles Times/Bloomberg poll conducted 4/8-11/06 finds presidential approval at 39% with disapproval at 57%. Approval is up one percentage point since the same poll in late February and down 4 points from January. Also in this graph is the Cook/RT Strategies poll of 4/6-9/06 which found approval at 37% and disapproval at 57%. (The Cook poll was included in an update to this earlier post but hasn't been featured in a new post, so I'm including it here.) For Cook, that is a decline of 3 points since late February and a 10 point drop since January.

The LATimes poll is the second poll to find an upturn in presidential approval (CBS is the other) since early March. Four other April polls have found declines from the previous poll by the same organization. Gallup found no change.

My local regression line is further flattened by the LATimes addition. It now estimates approval at 37.2%. The linear trend is at 36.3% but still lies below most of the polls. Unfortunately, the clustering of current polls makes it impossible to know what the current trend (over the past 2 weeks) has been. The good news is we've seen 7 new polls in the last week. But because these are so clustered between 4/5 and 4/11 we can't tell what the slope is. So... once more we need more polls. One has to hope that this doesn't represent a new clustering of media polls in the first week of each month. In order to monitor change in approval we need polls spread across each week of the month, not all clustered in the first week. (And it makes more sense for the media sponsors to spread their polling so they don't get lost in the clutter of many polls at once.)

The end of Gallup's relationship with CNN also raises the question of the frequency of Gallup's future polling. Their polling has been invaluable precisely because it is high frequency and high quality. We would not be able to monitor approval dynamics as well if USAToday/Gallup should cut back on the frequency of polls.


Click here to go to Table of Contents

Tuesday, April 11, 2006

CBS/NYT and Gallup approval at 37%


UPDATED below to include new Cook/RT Strategies poll completed 4/9 as well.

New polls by CBS News/New York Times and by Gallup/USAToday both place presidential approval at 37%. That is a 3 percentage point upturn for CBS/NYT and no change for Gallup. Both polls argue for a flatter trend in approval. Gallup, as editor Frank Newport argued, sees approval in a new "steady state", down from late January-early February but stable since mid-March. The upturn in CBS/NYT contrasts with their two previous polls at record lows of 34%. The effect on my local trend (solid red line) is more flattening since mid-March, and a further departure from the linear trend (green line) which continues to under-predict approval by about 1 percentage point.

It is interesting that the CBS/NYT reading returns that poll to the middle of other polls, after a two-poll departure from the range of other organizations. The first two CBS/NYT polls of the year were easily in the range of others, while the next two were below that range, along with a March Pew poll.

Footnote here: The CBS News and New York Times sometimes poll together and sometimes CBS is solely responsible for the poll. While it is undoubtedly clear to CBS and NYT, it is not always clear to readers, including this one. The lack of NYT coverage of this new poll suggests it is not a partner this time. However, the CBS web site refers to some polls (2/22-26/06) as a "CBS News Poll" with no mention (that I've found) of NYT. The NYT site posts results from what appears to be that same poll, and bills it as "New York Times/CBS News Poll". (The alternation of first position is, as I understand it, part of the partnership agreement.) The NYT post appears to include only a subset of items, so perhaps that explains the difference, but I'm forced to guess here. Because it isn't trivial for me to tell the difference, I refer to "CBS/NYT" for all their polls, regardless of which organization is actually responsible. This is one of the oldest and most distinguished polling partnerships, but with an apparent decrease in NYT participation in recent years it is unfortunate that sponsorship is not more transparent.

Based on the full set of polls, it seems clear that approval spent March and early April declining from about 39% to about 37%, without reaching the lows of 34% and 33% estimated by the CBS/NYT and Pew polls (or the sub-36% estimated by some of my earlier models prior to the recent polls.) This more modest decline is still bad news for Republicans but falls short of the "free fall" celebrated by Democrats. Unfortunately for the White House, it isn't possible to "celebrate" 37% approval, even if the rate of decline has slowed. (And something must be done to improve this if President Bush is to have any influence with Congress.) Unfortunately for Democrats the trend may be less of a story, so something else needs to be offered beyond dissatisfaction with the incumbent. (Despite commentary comparing the Democrats' position now to that of Republicans in 1994, I'm struck that what the Democrats need but don't have is a Newt Gingrich-- someone who has systematically and for a long while been developing talent on the bench and a winning story line. Without hitters you can't take advantage of weak pitching.)

Based on all the polls, my local trend estimate is 36.8% approval. The linear trend is at 36.0%, which I believe to be too low.

UPDATE 4/11: Late today the Cook/RT Strategies results came out. They match the 37% approval of CBS and Gallup. Here is the updated graph.


The new Charlie Cook/RT Strategies Poll conducted 4/6-9/06 finds approval of President Bush's job performance at 37%, down ten points from January and down 3 points since late February. As the increasingly crowded graph shows, the downward trend from February through April has been common to most of the polls. The local trend remains a shade under 37% approval (36.86% for the numerically obsessed.)


Click here to go to Table of Contents

Monday, April 10, 2006

ABC/WP: Approval at 38%


The ABC/Washington Post poll brings both bad and not-so-bad news to the White House. The new poll, taken April 6-9, finds approval of President Bush at 38% with 60% disapproving. That is a "new low" for the ABC/WP poll. (The story is here.) That's the bad news. This is consistent with recent polls from Fox, AP, and Time which have all registered further declines in the President's approval rating. Based on my local regression trend, approval has fallen from 42% in early January to just below 37% today.

The "not-so-bad" news is that this new data point remains above my linear trend even after adjusting for the ABC/WP house effect which tends to be about 1.5% more positive towards the president than the average poll. (See the discussion of house effects here. The graph itself is here.) This is still more evidence that while approval has continued down, the rate of decline is not as great as it was through February and early March. That may not be a very shiny silver lining for the White House, but it is all these data have to offer.

We also await new polls from CBS, Gallup, NBC and others to further clarify the present state of approval and the current trend.

UPDATE 4/11: The CBS and Gallup data are now in. See here.


Click here to go to Table of Contents

Friday, April 07, 2006

Presidential approval at 36% is new low for AP poll


The Associated Press poll completed 4/3-5/06 registered its lowest approval rating of President Bush, with 36% approval and 62% disapproval. Approval has declined from 40% in early February (2/6-8). The 1% decline since March 6-8 is not statistically significant. (See here for the problem of assessing change in consecutive polls.)

This new low comes on the heels of Fox's reading of 36% in a poll also completed on April 5. (See here). The Fox reading tied that poll's record low, registered in early November 2005.

These two new polls further suggest that approval has continued to decline, though at a slower rate than in February. My linear model continues to predict approval ratings that are too low: the current prediction is 35.5% approval, which is below the two most recent ratings of 36%. On the date of the latest Time poll, my model forecast 36.1% while Time's reading was 37%. So this does provide evidence that the decline is slower than my model predicts. If my linear model were capturing approval dynamics well we should see some polls above and others below my forecast. While recent polls are close to the predicted value, all are a bit above the predicted values. The clear bend in the local regression fit is also evidence for a slowing of the downward trend. Nevertheless, these data are still consistent with my previous claim that approval was continuing to decline despite arguments by others that it had stopped declining.

The AP results find low approval across a range of issues: handling the economy: 39-59; domestic issues: 37-60; foreign policy and the war on terror: 40-58; Iraq: 35-63; Katrina relief: 37-59. In short, the president has no strong suit left to play.

Republicans in congress also are suffering from declining support. The AP asked "If the elections for Congress were held today, would you want to see the Republicans or Democrats win control of Congress?" Republicans: 33%, Democrats: 49%.

Even a long term Republican strength has now reached parity: "Who do you trust to do a better job protecting the country?", Republicans 41%, Democrats 41%.

And "Who do you trust to do a better job handling the situation in Iraq?", Republicans 39%, Democrats 42%.

These results will make Democrats giddy with expectation and Republicans glum. For these views to translate into electoral success, however, Democratic congressional candidates must successfully transform this discontent into campaign rhetoric and ultimately into votes. That very much remains to be seen.

UPDATE 4/10: The ABC/Washington Post poll is now out. Here is the update.

UPDATE 4/11: Still more data, now from CBS and Gallup. The latest is here.


Click here to go to Table of Contents

Thursday, April 06, 2006

New Fox poll, approval continues decline to 36%


A new poll from Fox (4/4-5/06) finds approval of President Bush's handling of his job at 36% with disapproval at 53. This ties the record low for Fox taken 11/8-9/05, just before the White House launched a vigorous defense of the President's policies. That offensive raised approval to 44% in the Fox poll of 2/7-8/06, from which it has now fallen by 8 points.

I wrote last night about the dearth of recent polling. Fox perhaps is the first of a string of new polls we'll get by the middle of next week that will clarify what has been happening to President Bush's approval rating. I argued here that approval appeared to be continuing to decline. Frank Newport of Gallup argued that the decline had halted by early March. We've not had enough data to answer that but half dozen new polls in the coming week should help settle the issue.

In the graph above I've added Fox to the graph from yesterday's post. The three percentage point decline since Fox's previous poll of 3/14-15/06 is just shy of statistical significance, but combined with the evidence from Time and the somewhat older poll from Greenberg, it seems the decline in approval did continue through the end of March.

That said, the new data are continuing to "bend" my local regression model up from the linear decline (the green line in the figure). This suggests that while approval has continued down, it has been doing so at a slower rate than we saw in February and the first half of March.

The decline in Fox's approval poll was concentrated among independents, who fell from 36% approval in the 3/14-15/06 poll to 30% approval in the 4/4-5/06 poll. Republican support held steady at 74% while Democrats remained unmoved at 8% approval.

UPDATE 4/11: There are a number of new polls. See the Table of Contents here for them all.

Wednesday, April 05, 2006

Lack of new polls obscures Bush approval trend


Since March 17 there have been only three new national polls with presidential approval results released. This lull in polling couldn't have come at a worse time for those of us wondering if President Bush's recent emphasis on defending the Iraq war would put a brake on his declining approval ratings which have fallen some 6 points since late January. I posted on whether approval was still declining here, and wrote about the problem of recognizing poll-to-poll change here. In the nearly 3 weeks since, we've seen only 3 new polls. This will make answering the question of "what effect did the President's speeches and news conference have" much more difficult. By now, any such effect has also become confounded with the immigration debate and the Mexico trip. Still, we have to look at what the data say so far, and anticipate a flurry of new polls with the start of a new month.

Since March 17, Greenberg (Democracy Corps) has released one survey and Time has released two. These three data points are labeled in the figure above. I've also "connected the dots" to give a clear "apples-to-apples" comparison of trends in these two organizations' polls in 2006. Both are down slightly since late February. Greenberg has moved from 44% on January 25 to 41% on February 27 to 40% on March 20. The Time poll has moved from 41% on Jan. 26 to 40% on Feb. 16 to 39% on March 23 to 37% on March 30. None of the changes from one poll to the next is statistically significant though the change since January is close (4.4% change is the 95% confidence interval for two independent polls of 1000 cases each, which is the approximate size of all these polls.) See my post on poll-to-poll change if you think this lack of statistical significance is surprising.

In my model of approval, these new polls do not come close to producing a statistically significant change in the trend estimated since February 1. However, they are all three a little higher than the model predicts. If we plot the residuals of that model in the figure below, the deviation from zero is clear. The local fit line in the figure is bending up slightly, suggesting that the rate of change since January has been slowing slightly with time, rather than a constant decline as the model claims. This bend, however, is very slight and we still lack enough data points to reach a confident conclusion.


Taking out the house effects brings all three polls a bit closer to the predicted level of approval, but they remain a percentage point or two above the predicted trend.

And so the data refuse to give a clear answer. The downward trend in these two polls appears to have continued in March. The lack of statistical significance of those changes is to be expected given the spacing of the polls and the rate of change in approval estimated by my model. The three positive residuals also fail to indicate a significant change in approval, but they are consistent with a slowing of President Bush's decline.

And so in the end I say these results are not inconsistent with my earlier claim that approval was continuing to decline. Sadly, we'll never know what the short-term effect of the White House's new effort to rally support may have been, thanks to the surprising lack of polls these three weeks. But as new polls arrive (and surely they will) we will finally be able to get reliable new estimates of the approval trend since mid-March.

UPDATE 4/11: Lots of new polls have finally arrived. See the Table of Contents here for the latest.

Tuesday, April 04, 2006

Party ID and presidential approval


While party identification at the individual level has a strong effect on approval of President Bush, variation in partisanship across polls accounts for relatively little (12%) of the variation in presidential approval ratings. The implication is we should be less obsessed with the party balance across polls. In only 12.1% of polls over the last 15 months has the partisan balance made more than a +/- 1% difference in approval. In NO polls over that time has it made as much as a +/- 2% difference.


Those of us who obsess about polls have a tendency to judge the quality of a poll by its partisan balance, especially if the results displease us. So when we see a poll with 28% Republican identifiers and a low approval rating of President Bush, we quickly dismiss the polls as obviously biased because we know Republicans make up at least 31% of the population and for this reason the poll underestimates support for the president.

What the analysis here shows is that the effect of the partisan distribution in a poll has less impact on that poll's estimate of approval than is often assumed. The effect isn't nil, but neither is it large. While we may still want to consider the partisan balance in polls, we need to take care that we are not confounding house effects, which persist across polls, with random variation which does not. In a previous post here, I showed that polls vary dramatically with respect to their partisan balance. These house effects largely have to do with how the poll treats independents. Some produce far more independents than others, and so produce fewer partisans of both camps. But random variation also affects polls within survey houses. That variation MAY affect the estimated approval level, but the partisan rhetoric exaggerates this effect.

Survey houses have characteristic levels of partisanship which are due to question wording and training of interviewers, among other things. Obviously different questions will produce different answers. Fox, for example, asks if the respondent is Republican or Democrat but omits mention of the possibility of being independent. Not surprisingly, Fox produces very large percentages of Reps and Dems but few independents. Other houses offer "Republican, Democrat or Independent", while some add "or something else". The latter produce more respondents who don't fit the three standard categories. And some train interviewers to probe for a party if the respondent says "don't know" or "none", while others teach interviewers to code these respondents as "other party". As we saw before, this variation in house effects accounts for a large amount of the variation in partisanship as measured across polls.

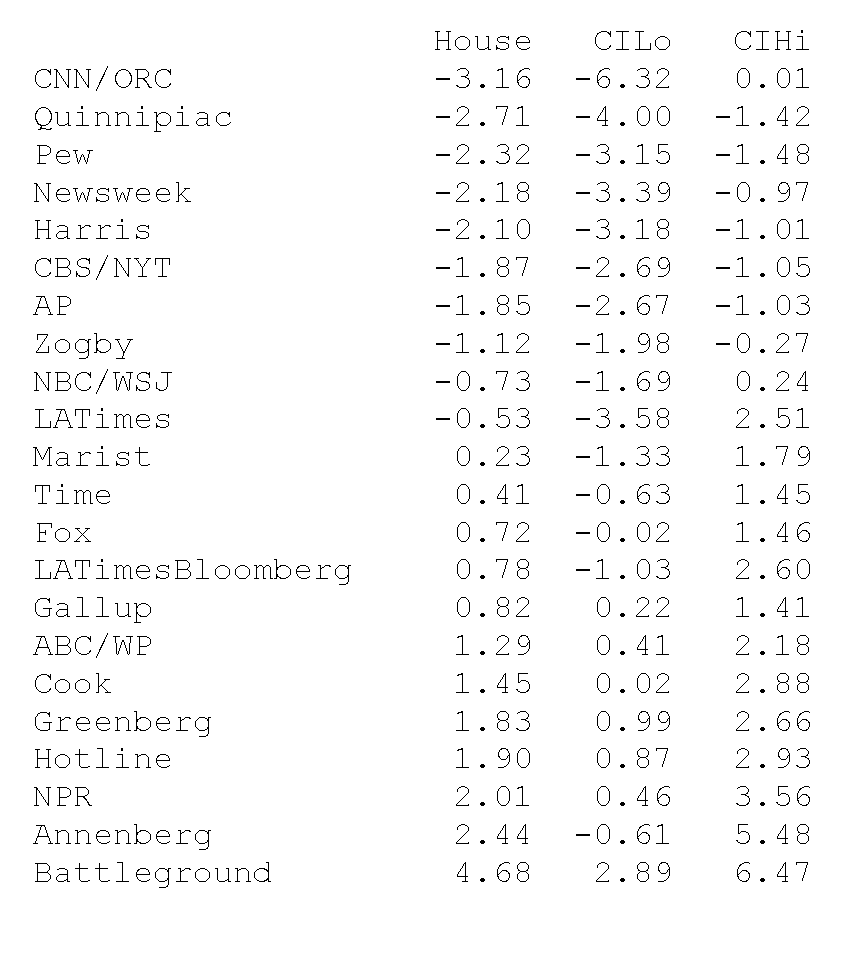
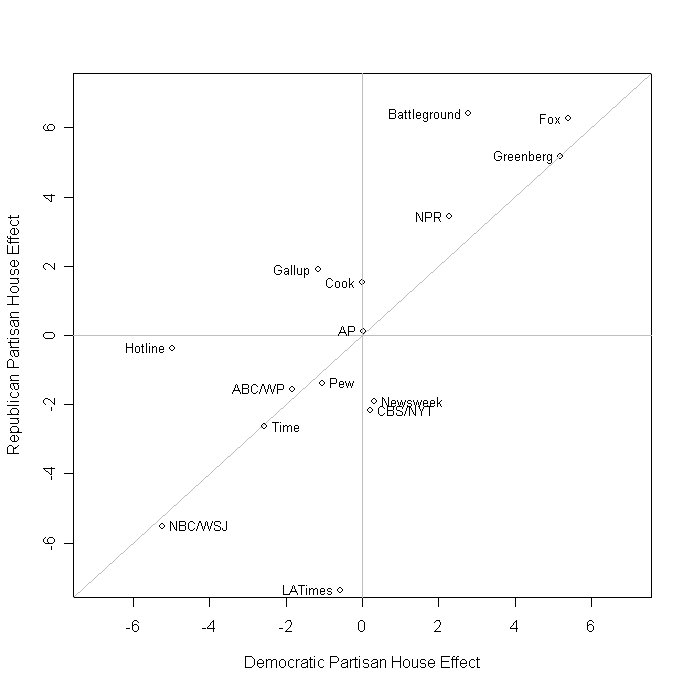
The graph below shows that these house effects are positively related between Republican and Democratic identifiers. This is another way of seeing that the primary action here is in the proportion of independents, rather than the relative balance of the two parties. Pollsters are not biased towards "Dems" or "Reps" but rather the house effect is more or fewer independents. The graph shows the estimated house effects for Democrats and Republicans. The strong positive relationship indicates that houses tend to be low on both or high on both--- indicating that how they treat independents is the primary "bias" (that is a technical term but has unfortunately strong negative colloquial connotations. I'll try to avoid it, even though it is a perfectly good term in technical statistics.)


Fox and Greenberg (opposites ideologically, if you buy the common stereotype) both register more Republicans, but they ALSO typically find more Democrats as well. NBC/Wall Street Journal has an amazing ability to find independents, and so they tend to find almost 6% fewer Republicans AND 6% fewer Democrats than the average pollster.

As we saw in the previous post, these house effects lead to substantial differences in partisanship across polls. But how much effect is there on presidential approval?

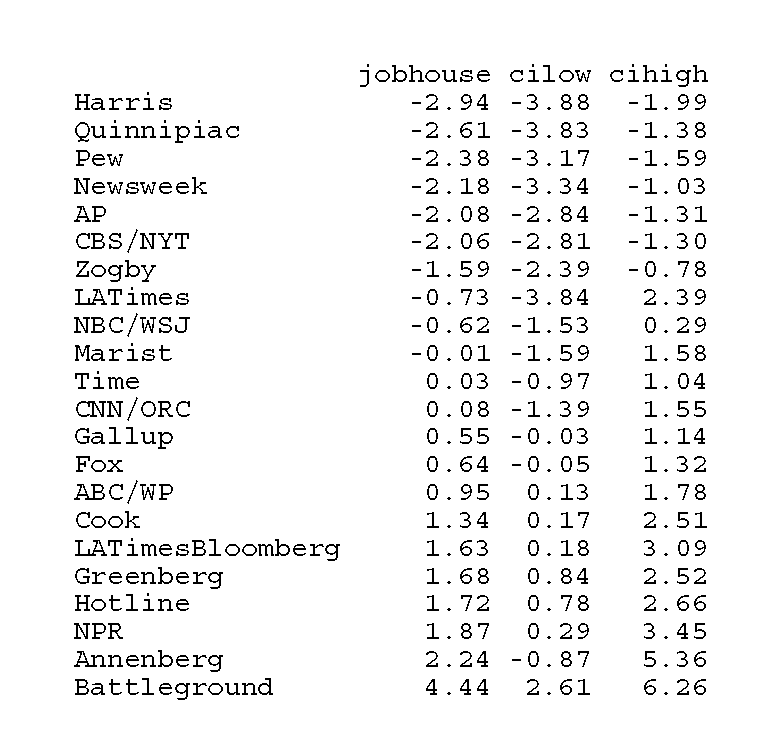
To look at this, I first estimated models that estimated house effects for approval (accounting for trends and events in 2005-06) and for partisanship (accounting for the trend over 2005-06 plus the house effects). A survey house that systematically includes too many Republicans may overstate President Bush's approval. However, the above figure shows that this isn't what most house effects do. Either the survey house is low on BOTH Reps and Dems, or high on both. Rarely does a house really favor one party over another. The net effect on approval then is relatively modest.

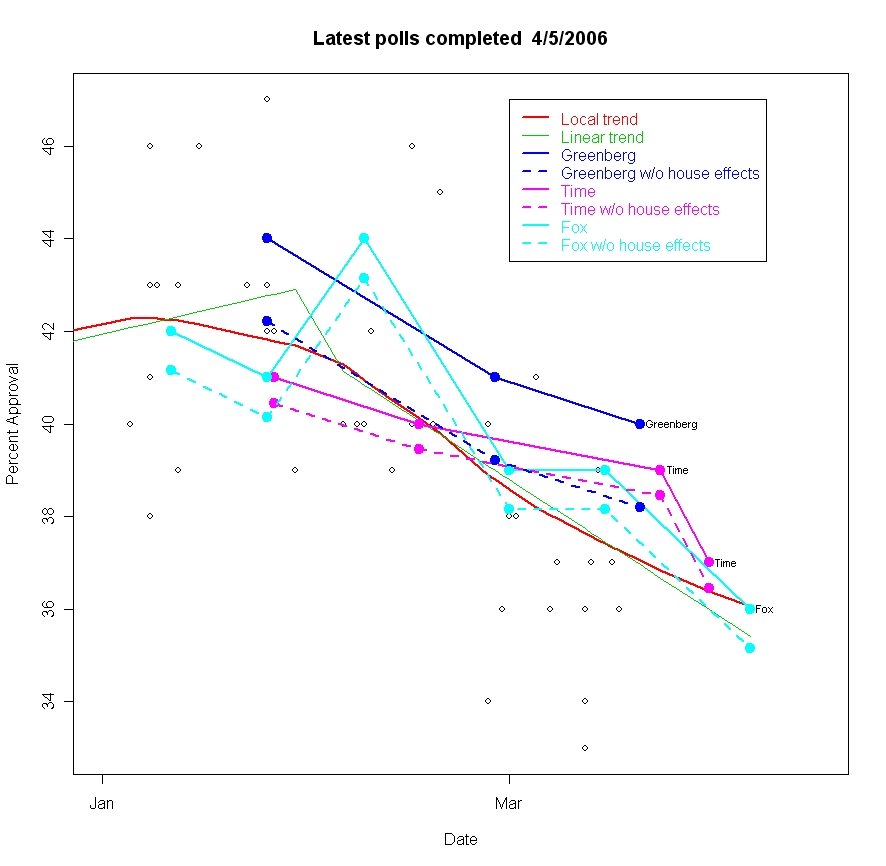
To see this, the figure below plots approval and partisanship, both NET OF HOUSE EFFECTS. I've estimated my standard model of approval which includes linear trends that decline over 2005-06 plus shocks for Katrina, the Libby indictment, a trend up after the president's defense of his policies from 11/11/2005-1/31/2006, and a new decline following the State of the Union Address. I also include house effects for all pollsters. The net effect is then the variation that is not accounted for by the model.

The net partisan effects capture how each poll varies from what we would expect given both house effects and the long shift in partisanship since January 2005. (Read about that here.) So the figure below shows how polls varied in approval from what we would expect given trends and house effects, as a function of how they varied due to partisanship in the poll, again net of house and trend effects. The figure also shows the covariation of partisan categories across polls.


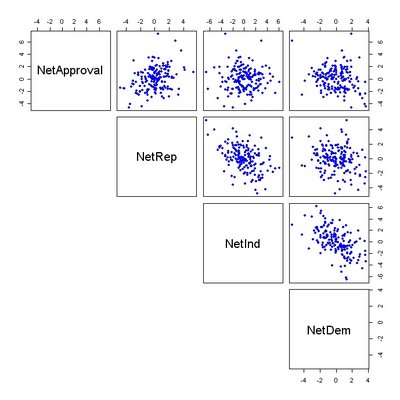
What is striking in the first row of the figure is that net approval really doesn't vary that strongly with any of the net partisanship figures. Again, think net approval as the variation in approval beyond what we would normally expect for a survey house. Think of net partisanship as variation in party beyond what we would normally expect for that house. So if Gallup is normally 31% Republican, but a particular Gallup survey found 29% Republican, they would be a -2% in the Republican panel above. And so on for the other parties. Likewise if we would predict that poll at that time to be 44% approval but we found 46%, then the "Net Approval" is +2% in the figure.

But what we see is that while there is a statistically significant tendency for net approval to rise with net Republican, the effects are quite small. The effects of net independent and net Democrat are even smaller. If we predict net approval from all three net partisan categories, the model accounts for only 12% of the variance in net approval, a quite modest amount.

Given estimates of the house effects and the partisan composition of each of the 173 polls taken between 1/1/2005-3/31/2006 for which I've gotten both partisanship and approval data, I can estimate how much partisan composition matters in approval ratings. The surprising answer is not so much. The figure at the top of this post shows that only 12.1% of the polls in this time differed by more than 1% of what was predicted due to partisanship distribution in that poll. And not one of the 173 polls differed by more than 2% of what we should have expected.

This may seem puzzling, given that 80% (more or less) of Republicans approve of the job President Bush is doing, while 90% (more or less) of Democrats disapprove. So you'd think that for every 1% change in Republicans you'd get a .8% change in approval and for every 1% change in Democrats you'd get a .9% change. Ahh, but don't forget the independents! They buffer the changes in partisans, and in fact the correlation between percent Rep and Percent Dem in a poll is only about .2-.3, quite a modest correlation. There are also between zero and ten percent "other", depending on the survey house, which further buffer partisanship. So while in a single poll it may well be true that 90% of Dems disapprove and 80% of Reps approve, across polls the effects are not so strong. For one thing, the percent approving WITHIN each partisan category ALSO varies across polls. So the amount of variation across polls is considerably more than you would estimate from looking at the cross tab of approval by party in a single polls.

The bottom line, based on these 173 polls, is that it takes about a 5% shift in Democratic identifiers to produce a 1% shift in approval. Among Republicans, a 3.3% shift in partisans shifts approval by 1%. Since, in fact, few polls vary by much more that +/- 3% from THAT POLL'S normal partisan distribution, the estimated approval rarely differs by more than 1% from what we would expect, and almost never by as much as 2%.

When I run a poll, one of the first things I look at is the partisan distribution. It is an important diagnostic for how well my sample represents the population. But while party identification is powerful at the individual level, there is quite a lot of variation across polls that is not due to partisan balance alone. The current obsession with partisanship in polls has caused us to exaggerate the impact of partisan balance on other estimates in the poll. Of course we should care about the partisan distribution, but all too often we exaggerate its impact. For the last 15 months it has never caused as much as a 2% shift in approval, and only rarely more than a 1% shift.

Compare approval across polls to the results of other polls, their trends and take account of predictable house effects. What's left due to partisan balance is usually modest.


Click here to go to Table of Contents