Thursday, May 25, 2006

Hotline poll has Bush Approval at 37%


The Diageo/Hotline poll taken 5/18-21/06 finds approval of President Bush at 37% with 61% disapproval. This is a decline of 8 percentage points in approval since the Hotline last interviewed a national registered voter sample 2/16-19/06. As the figure above makes clear, Hotline polls have run roughly parallel to the estimated trend in approval, but with a substantial positive house effect in the last four polls. Through 2005 this difference was less pronounced. Based on all 2005 and 2006 polls except this last, the house effect for approval in Hotline polls is +1.90 percentage points. (See the post on house effects here.) Adjusting for that, we would estimate that approval is about 35.1%, based on the Hotline result.

This is above my current trend estimate based on all polls (including this latest Hotline) which stands at 33.3%. The last four polls have all come in above the estimated trend, even after house effects are removed. Though short of statistical significance, these continue to suggest that President Bush may have gained some improvement in his approval ratings following his immigration address on May 15. Past experience suggests that it requires 6-12 polls for my model to clearly signal an upturn in approval. So far the evidence is favoring a rise of 3-4% in these last four polls, compared to the previous trend. Only a sustained improvement in more polling will clarify that.

Hotline Editor Chuck Todd points out that there has been substantial decline in approval among Republicans, from 83% in February to 70% in May. Approval among Independents is also down from 41% to 33%. This resembles rather well the trends we've seen in other polls during the spring, though the exact levels among partisan categories tend to vary quite a bit across polls. Because of the large gap between Hotline Polls (they did Dem and Rep presidential preference polls in the interim) it is impossible to guage short term trends, so these results simply reflect the fact that it has been a hard spring for the White House. We'll see if that is turning around now or not with the addition of new polling next week.


Click here to go to Table of Contents

Friday, May 19, 2006

Fox finds Bush approval at 35%


A new Fox News poll taken 5/16-18/06 finds approval of President Bush at 35%, with disapproval at 56%. That matches the new CBS News poll and is a point below the 36% reading by CNN. The three polls together provide some evidence that approval may have moved up following the president's Monday night address, though the data remain short of statistical significance. With all three new polls in the data my trend estimate stands at 33.01%, nearly a full point above my estimate as of 5/16 polling which was 32.05%. These revised estimates do NOT mean that approval has turned up, but they do mean that all the polls, when taken together, are painting a less bleak picture for the White House. It takes 6-10 polls for my model to detect a clear upturn in approval, so watch that trend estimate-- if it continues to move up over the next several polls, we'll see a bend start to form in the downward trend line.

The Fox poll is actually a 3 percentage point decline from Fox's previous poll on 5/2-3/06. But that poll was unusually high. I wrote about it here pointing out that Fox appeared to have been too low in the previous poll, then too high at 38%. I concluded
So the rebound from 33% was to be expected. The 38% seems too high now, so I'll bet on another decline to about 34% in the next Fox poll (which should appear in a couple of weeks.)
The actual new Fox poll at 35% is a point higher than the 34% I predicted based on the prevailing trend of two weeks ago but does represent the predicted return in the direction of my estimated approval level. In this case, a decline in Fox's poll was actually still good news for Bush-- it was better than expected.

The confluence of three polls this week all registering 3-4 points above my prior estimate (now I mean the estimate BEFORE these polls were added, 32.05%) may indicate some real improvement in the president's standing. At the least they suggest the rate of decline may be a bit less this week than it has been, and at most they may signal a positive turn. See my post on CBS and CNN for more discussion about how political debate over immigration is an opportunity for the White House, but with the threat that Republican members of Congress may stiffle potential gains with their vocal criticism of the president's position on immigration.


Click here to go to Table of Contents

Bush approval up in CNN 36%, CBS 35%


President Bush's approval ratings have moved up in two polls taken after his Monday evening address on immigration. A CBS News poll taken 5/16-17/06 found approval at 35%, disapproval at 60%. That is a 4 percentage point increase in approval since CBS' previous poll on 5/4-8/06. A CNN poll also conducted 5/16-17/06 found approval at 36% and disapproval at 57%, a 2 percentage point increase from their 5/5-7/06 poll. With the addition of these polls, my trend estimate is revised up to 32.8% from 32.05% as of polling through 5/15. (This shift doesn't mean that the trend is now up. Rather it means that based on ALL the polling through 5/17 we should estimate approval at 32.8% instead of 32.05%. Only if the shift continues for several new polls will we see the estimate turn up, as it did, for example, back in November. But it takes about 6-10 polls before such a change can be confirmed.)

The margin of error for the change in the CBS polls is 4.6%, so this 4% gain falls just inside that margin. For CNN the margin for the change is 4.2%, so their 2% gain is not close to statistical significance. However, I've warned before that we should not be too focused on statistical significance in changes over short periods. The real issues will be whether other polls also pick up this upturn and if they do whether the upturn is sustained.

(For the geeks, these margins are for the significance of a difference of independent proportions, so the formula is 2*sqrt(var(poll1)+var(poll2)), where var() is the variance for each poll. Var() is p(1-p)/n, where p is proportion approve, n is sample size. The new CBS has only 636 respondents so that margin is a bit larger than CNN's.)

Despite the lack of statistical significance, there is a good reason to expect some upturn following Monday's speech. Presidential addresses give would-be supporters a set of reasons to approve. The president states his case in the most persuasive form his speech writers are able to craft. Those predisposed to like the president (co-partisans and ideological fellow travellers) are generally accepting of his arguments. The upshot should generally be some increase in approval unless at the same time he alienates his partisan opponents further.

But this week also gives us a clear example of the problems with attempts to influence the public. Elite reaction also matters, and this week many GOP House members and other conservative opinion makers have been swift to attack the president's proposals. Here in Wisconsin it was striking to read the comments of Congressman James Sensenbrenner (R-5th CD), the chair of the House Judiciary committee. For a president struggling to regain support it is hard when your own troops are shooting at you. If co-partisans receive negative messages from trusted sources at the same time they are processing the president's positive message, the result is certainly a dampening of whatever gains the speech might have produced. Since it takes time for the criticisms to spread through the public, this will have more influence on later polls as compared to these two taken in the two days after the address.

While readers of this blog are obviously an opinionated group, it is worth emphasizing that for most citizens politics remains fairly distant from everyday experience and concerns. That means that it matters a lot how elites package messages and whether the sources of those messages are united or divided in their views. Immigration is an excellent example of this. While many members of the House, such as Tom Tancredo (R-CO 6th CD) have lead the campaign against illegal immigration, most citizens don't have firm opinions on this issue in the absence of elite stimulus. And citizens aren't that concerned with immigration (illegal or not) in the absence of elites telling them it is important. Contrast that with the war in Iraq and the economy which are of lasting concern. In the figure below I plot the "Most important problem facing the nation today" from CBS News polls from 11/18-21/04 through 5/16-17/06.


Compare the trend in immigration and social security with those of Iraq, the economy and gas prices. Iraq has consistently remained high. The economy is high, yet is slowly trending down in response to a solid economy, showing that this measure does change in response to the real world. And concern over gas spikes up in obvious response to sudden gas price hikes.

In contrast, in the absence of elite leadership, immigration and social security remain peripheral concerns for the public. President Bush's social security reform effort in early 2005 only managed to raise the issue to a 6% most important problem rating. The immigration issue has been under 5% until April 2006. Now nothing significant changed about the number of illigal immigrants between March and April. Their role in the economy did not shift. Rather what happened was that elites began a debate on the issue. Elected officials, news writers, opinion writers and our friends on talk radio (and the blogs!) began to debate the issue. And the public responded in a predictable way. With the support of elite debate, the MIP rating for immigration has climbed to 12% in the latest CBS News poll.

But that 12% means that most people still haven't seriously thought about illegal immigration. The initial impulse of most respondents is actually pretty close to the President's position: some form of guest worker program is approved by 61%-36%. Allowing illegals who have been here 5 years to stay if they pay a fine, learn english, have no criminal record and pay back taxes is favored 77%-19% (though note the lack of "become citizens" in the question wording.) And a solid majority favors sending the National Guard to the border: 62%-32%. Except for the Guard, partisan divisions on these questions are quite muted. All these results are from the CBS poll. Time polls from December, January and March (before the debate heated up) found similar percentages with somewhat different question wording on guest workers and a chance to "earn citizenship" for long-term resident illegals.

So I think President Bush has in fact taken positions that are well supported by the public at large and among Republican citizens as well, despite what some GOP House members say. That leads me to think that the current tick up in approval in CNN and CBS may in fact represent an actual positive response to the President's Monday address, even though the polls did not change to a statistically significant degree. I also think this is an area where presidential leadership might affect public opinion (and approval might improve in turn as a result.) However, it is hard to see how that happens with a GOP House that is so bitterly divided over an issue that a majority of the public (and of Repubican citizens) favors. I expect we'll see further polarization of opinion in the public, reflecting that elite divide. (And don't forget, many pro-labor Democrats have a problem with immigration as well. That is another reason why elite leadership sould be expected to matter on this issue-- it doesn't fall neatly into Rep vs. Dem.)


Click here to go to Table of Contents

Thursday, May 18, 2006

Zogby: Bush approval at 32%


A new poll from Zogby (5/12-16/06) finds approval of President Bush at 32%, disapproval at 68%. With the addition of this poll, my trend estimate now stands at 32.05%, continuing down from 32.2% as of polling through 5/15.

There has been little variation in the rate of approval decline since the State of the Union address on January 31. Over the period from 2/1/06-5/16/06 the rate of decline has been -.074% per day, or one percentage point each 13.5 days. As of the first of May that estimate was slightly lower, one percentage point each 13.9 days. This is NOT a statistically significant difference, but remains a perilous rate of decline for the White House. No news there. Still no sign of a lower limit (though I don't think we are close even if there is such a thing.)

Despite the recent Harris poll at 29% approval, at this rate it will be June 13 before the trend estimate reaches 30% approval. I keep waiting for this rate to change. The President's Monday night address on immigration is not yet a significant factor in the polling. CNN's snap poll found 40% of speech viewers responded "very positively" and another 39% "somewhat positively". But this is a highly self-selected sample of viewers of the President's address. MysteryPollster has written convincingly on the bias inherent in such polls (see his related pieces too) and I think their results are highly suspect if extrapolated to the population of adults. So let's see some new national samples of post-speech respondents to estimate any impact of the address. Given the elite fury this week, I doubt we'll see a "win". If there was a window for presidential leadership on this issue it appears to have closed. (And I thought there WAS such a window a few months ago.)

Zogby uses a four point approval question:
“Overall, how would you rate President Bush's performance on the job? Excellent, Good, Fair, or Poor?”
This is similar to Harris' four point phrasing, but not quite the same. Harris' is
"How would you rate the overall job President George W. Bush is doing as president: excellent, pretty good, only fair, or poor?"
What is the difference between "good" and "pretty good" and between "fair" and "only fair"? In my post on Harris' 29% approval poll, I speculated that "only fair" might be attractive to disillusioned former Bush supporters, partially accounting for the low 29% approval rate. The Zogby poll is 3% above that reading, with a similar if not identical "fair" option. The difference is within the margin of error, but not entirely consistent with my speculation, which would have predicted Zogby to be clearly below trend, which it is not.


Click here to go to Table of Contents

Tuesday, May 16, 2006

ABC/WP puts Bush approval at 33%


The ABC/Washington Post poll taken 5/11-15/06 finds approval of President Bush at 33%, with disapproval at 65%. That is a drop in approval of 5% since early April, and 13% since early January in ABC/WP polling. With the addition of this poll, my estimate of approval has moved back down to 32.2%, a bit lower than the estimate of earlier today which included the latest Newsweek and Gallup polls (32.4%.) Those polls were completed 5/12 and 5/11 respectively, so this change in my estimate reflects approval as of 5/15, the end of ABC/WP interviewing.

As with other recent polls, we can look at the recent track record of ABC/WP polling. The "house effect" for ABC/WP is estimated at +1.29%, and from the green line above it is clear that they have almost always been a bit above the blue trend line for all polls. There were two ABC/WP polls in December and early January that produced exceptionally large estimates of approval, compared to the estimated trend at that time. Since then, the last four polls have been reasonably close to the trend, in line with the estimated house effect.

The five point decline since the last poll reflects both "true change" and a bit of sampling noise. The trend estimate has declined from 36.1% to 32.2% since the last ABC/WP poll on 4/9, a 3.9% drop compared to the 5% change in the poll estimate. The current poll result is a little closer to trend than was the 4/9 reading, accounting for some of the difference.

Bottom line, the new ABC/WP is quite closely in line with the estimated trend in approval. That was less so at the end of the last and the beginning of this year, leading to some overstatement of the magnitude of the decline if one only compares the early January ABC/WP poll (46%) with the current one (33%). The actual decline in that period is approximately from 42% to 32%, or about 10 percentage points.


Click here to go to Table of Contents

Gallup moves Bush approval up to 33%


A now slightly stale Gallup poll, taken 5/8-11/06, moves approval of President Bush up slightly to 33% approval, 61% disapproval. This poll seems to have gotten crowded out over the weekend by the NSA telephone records story, and a subsequent Gallup poll for USAToday. Hotline carried the poll results today, and Gallup now has them on their front page. I've not seen a story in USAToday based on these results.

With the addition of this Gallup result (and the previously released Newsweek poll that interviewed 5/11-12/06, discussed here yesterday) the president's approval trend estimate stands at 32.4%, up a tenth from yesterday's 32.3% estimate.

I haven't plotted Gallup's track record in a while, so this is an opportune moment to look at it. The Gallup "house effect" is a slightly positive 0.82%, compared to the average of all polls. From the figure it becomes apparent that this effect was greater in early 2005 but has declined over the past months to more closely mirror the overall approval trend. We saw here that Gallup's trend in party identification was steeper than most in the first half of 2005, suggesting that some of the decline in the house effect may have been due to a shift in the percentage of Republican identifiers. Since January, the Gallup track has followed my trend estimate very closely, in fact.

A couple of months ago I differed with Gallup over whether President Bush's approval ratings had stabilized. With the clarity of hindsight, I think this plot makes it clear that what appeared to be stability for four polls (all 36-37% approval) was in fact pretty close to the continued decline my trend estimate was arguing for at the time. In fact none of those four polls is at all far from the trend-- they just bounce around it in what gives the impression of a plateau but is in fact just a +/-1% noise around the trend. This is why small movement in closely spaced polls should not be taken as a sign of "stability."

The Gallup poll of 5/5-7/06 that found approval at 31% is almost exactly 2% below my estimated trend for the time, another example of random fluctuation, though in this case one much seized upon to further the story of President Bush's declining approval. As my trend makes clear, approval HAS continued down at a substantial rate. However, the Gallup and CBS/NYT estimates at 31% and the Harris estimate at 29% appear a bit premature. They are well within the margin of error for the trend, but should be balanced by the higher readings from CNN and Newsweek (and the somewhat earlier readings by Cook and Fox.)

My trend estimate of 32.4% approval should be bad enough for those who are cheering declining approval, and 32.4% should be no comfort to the president's supporters. When either side seizes on polls a bit below or a bit above that estimate they are building their hopes on random chance, a chimera certain to turn on on them.


Click here to go to Table of Contents

Monday, May 15, 2006

Favorability towards President Bush


See the UPDATE at the bottom of the post for a personal approval question that does indeed show approval in the 60% range.

Presidential advisor Karl Rove made a curious statement Monday (5/15) in a speech at the American Enterprise Institute. (More on the speech here, and transcript here.) Rove said
"The polls I believe are the polls that we (...) run--- that get run through the RNC--- and I look at those polls all the time. The American people like this president. His personal approval ratings are in the 60s. Job approval is lower. And what that says to me is that the people like him, they respect him, he is somebody they feel a connection with, but they are just sour right now on the war and that's the way it is going to be. And we will fight our way through." (My transcription based on NPR audio of Karl Rove speaking).
This surprised me because I hadn't seen personal favorablity towards President Bush in the 60% range for some time. When I plot the data above, it is clear that public favorability ratings of the president have suffered somewhat less than his overall job approval, yet both have turned down since January 2005, and favorability is only about 40%, certainly not in the 60s.

Favorability is routinely asked with some variation on the question
"We'd like to get your overall opinion of some people in the news. As I read each name, please say if you have a favorable or unfavorable opinion of these people-- or if you have never heard of them. How about George W. Bush" (Gallup wording).
At the beginning of the administration, from January-August of 2001, the favorability rating did run as much as 10% higher than job approval. But in the immediate aftermath of 9/11, job approval outpaced favorability, though both surged considerably. By the start of 2002, favorability and job approval matched each other quite closely. Job approval shows more responsiveness to short term shocks, such as the start of the Iraq War and the capture of Saddam Hussein, but in general the two track very closely through the 2004 election campaign. Only in the aftermath of that campaign does favorability move clearly above job approval again. From January 2005 through November 2005, this pattern remained. When job approval rebounded in late November 2005 through January 2006, the gap narrowed. Since February, both have fallen, though job approval has fallen at a faster rate, reopening the gap between them.

So in general, it has not been the case the President Bush's personal favorability ratings have been markedly higher than his job approval. Only in the first 8 months of the administration, and in the period since January 2005 through the present has this been true. While some differences do now exist, they are not particularly large.

But more puzzling is what Mr. Rove meant by "His personal approval ratings are in the 60s." It appears clear he could not have been refering to the usual favorability ratings, as we can see in the graph above. "The 60s" are far from the current trend in favorability. We might imagine RNC polls that differ somewhat from public poll results, but certainly not by this magnitude. Republican pollsters are among the best in the business and certainly do not routinely produce highly biased results.

There are no other "personal approval" ratings that are commonly published by media or other polling organizations that I am aware of. In the late Clinton administration some polls asked questions aimed at distinguishing approval of Clinton's handling of his job from his personal life. ABC's question was fairly typical:
"Do you approve or disapprove of the way (Bill) Clinton behaves in his personal life?"
Yet this form has not been asked in public polls so far as I've been able to determine since President Bush took office. (Any helpful pointers to items would be welcome.)

It is possible that the RNC polls Mr. Rove referred to ask items aimed at President Bush's personal rectitude, and those might well be expected to run higher. Alas, the RNC is not in the habit of posting their polling results to the web.

So the question I would wish someone to ask Mr. Rove is "which `personal approval' item are you citing", and I'd also like to know if these results are for a sample of adults. If not, then a sample of Republicans or former Bush voters might more plausibly produce favorability ratings as high as the 60s. Given Mr. Rove's concern for rallying supporters, this might be a plausible interpretation of his statement. But the quote is a puzzle without more information.


UPDATE (5/18): An alert reader pointed me to an example of a personal approval item that does indeed reflect Mr. Rove's comment. The GWU Battleground poll is conducted by a partnership of The Tarrance Group (R) and Lake Research Partners (D). Their February 12-15, 2006 poll contains the following interesting item:
Q14. Whether you approve or disapprove of the way George W. Bush is handling his job as President, what is your impression of George W. Bush as a person? Do you approve or disapprove of him?
Approve (strongly+somewhat): 60%
Disapprove(strongly+somewhat): 33%
Unsure: 7%

This is similar to what I suggested might be the case---
It is possible that the RNC polls Mr. Rove referred to ask items aimed at President Bush's personal rectitude, and those might well be expected to run higher. Alas, the RNC is not in the habit of posting their polling results to the web.
Whatever the RNC polls show, at least we have this Battleground poll to clarify the distinction between job approval, the standard favorability item, and this personal approval question.

At the same time the Tarrance/Lake polling found personal approval at 60%, they found job approval at 46% and favorability at 45%. That tracks pretty well with approval in early February (and the positive house effect for Battleground polls, a huge +4.65% though based on few polls so caution is appropriate.)

So two points. While favorability is often influenced by personal impressions, it appears from the graph above that this element of presidential evaluation has become so entangled with job performance for President Bush that the two measures don't vary independently to any significant extent. Favorability is a little higher over the past 16 months, but the two track closely with each other.

The personal approval item, on the other hand, does show what Mr. Rove said it did: at a personal level, setting aside job performance, the public still has a strongly positive view of Mr. Bush.

So if that was the item he had in mind, the data support Mr. Rove's claim.

What is left unclear is how much influence this item might have on electoral behavior. I think you could make an argument that President Bush's personal appeal was a significant help in 2000, when it was common to hear that people would rather go fishing with Bush than with Gore. And I think you could make an argument that Kerry's personality put some voters off in 2004 when compared to Bush. But I'm not at all certain that this personal appeal can be the key to either recovering the president's job approval rating or to holding Republican congressional seats. Those goals must, I think, rest on improved policy performance and not so much on personal charm.


Click here to go to Table of Contents

Newsweek: Bush approval at 35%


Newsweek's poll, taken 5/11-12/06, finds approval of President Bush at 35%, with disapproval at 59%. The 35% reading is a bit above recent CBS/NYT, Gallup and Harris figures that are all at or below 31%, but the Newsweek result is in line with Cook, CNN and AP polls of recent vintage. In terms of my model's estimated trend, Newsweek is within the usual margin of error for the trend. The trend stands at 32.3% (including the Newsweek poll). My 90% confidence interval around the trend is +/- 3.7%, so 35% is confortably within that range.

It is interesting to look at the history of Newsweek polls since January 2005. Newsweek does relatively little polling, but they have been consistently below the trend for all polls. The estimated "house effect" for Newsweek is -2.18% compared to the average across all polls. As the light blue line in the figure shows, that negative house effect has been quite consistent. Until this latest poll.

The take home point is that even a consistent house effect remains subject to random variation in individual polls. That Newsweek is above trend this time doesn't imply that it will stay there. If the past is a guide, we should expect the next Newsweek poll to again be somewhat below trend. And if that happens, we shouldn't confuse a large downward change with all being due to "true change". Some of it is just replacing one (postive) random number with another (having expectation -2.18.)

(Apologies for the tardy post-- much family activity this weekend.)


Click here to go to Table of Contents

Friday, May 12, 2006

Bush approval below 30% in Harris Interactive


Harris Interactive on Thursday became the first poll to find approval of President Bush below 30%. Their poll of 1003 respondents taken May 5-8 found approval at 29% and disapproval at 71% according to Reuters. Harris Interactive does not yet have a release about the poll on their website (as of 9:41 CDT 5/12). With a margin of error of +/-3% this result is not statistically different from the CBS/NYT and Gallup results at 31%. However, the psychology of being below 30% is probably more damaging than the 2% difference warrants. Certainly the coverage of this result will be celebrated on the left and ignored or belittled on the right. (See MysteryPollster's nice discussion of this here.) Even including the Harris result, my model of the trend (the blue line in the figure) stands at 32.4% approval. That is dropping rather faster than in April but is still not at 30% or below.

Harris Interactive also has a "house effect" estimate of -2.10%, meaning we would expect them to be two percentage points below the average poll result. Given that my model says approval on average is 32.4%, they are one and a half points lower than we would expect. That could easily be due to random sampling variation given the 3% margin of error for the sample size.

One interesting point about the Harris Interactive poll is that their approval question differs from most. Harris asks a four point approval item:
"How would you rate the overall job President George W. Bush is doing as president: excellent, pretty good, only fair, or poor?"
"Excellent" and "pretty good" are considered "approval". Most other pollsters use a dichotomous item. Gallup's is typical:
"Do you approve or disapprove of the way George W. Bush is handling his job as president?"
The difference in wording is one possible reason for the house effect, but moreover I think the "only fair" option becomes very inviting to disappointed Republican's right now, as compared to choosing the blunt "disapprove" on the more common question. Depending on the inflection, "only fair" can sound more or less bad. And if you are a past supporter of the President who now wishes the White House were performing better, I think "only fair" would capture your feelings quite well. When approval is higher overall, you'd expect that most Republicans and conservative independents would be in the "excellent" or "pretty good" categories, and that "only fair" and "poor" would be mostly Democrats. But with approval at such a low level, the "only fair" refuge may be pulling more of these respondents. The result is that the Harris item produces results a bit less approving of the President. (Of course, if we had the raw data we could test this hypothesis. For now, it is just speculation.)


Click here to go to Table of Contents

Wednesday, May 10, 2006

Approval and Midterm Seat Loss: Two Problems


While unpopular presidents see their party lose more seats at midterm elections, the relationship is so noisy that predictions are relatively worthless. What is more, the simple prediction of seat loss from approval leads to predictions for 2006 that are wildly out of line with most informed opinion. This doesn't mean we shouldn't look at the data or the election forecasting models but it does require that we mix our enthusiasm for prediction with some sober realism about the uncertainty in such forecasts.

President Bush's recent decline in the polls has led many to conclude that Republicans in congress are doomed next November. I've pointed out here that the president's approval ratings are (almost) unprecedented for a midterm election, and that we simply don't know what a president with an approval rating in the high 20s or low 30s would do to his party's Congressional fortunes. I stand by that, but at the same time we need to take a look at the historical record of approval, seat change and the noise in that relationship.

The figure above plots the change in House seats for the president's party in each midterm election since 1946. (I left 1946 out in the earlier post, but reader comments have convinced me to include it.) In all but two years the president's party loses seats. That is one of the most reliable regularities in American politics, or at least it was until 1998. Prior to that, 1934 was the last time a President's party gained seats in a midterm. Before that only 1902 saw a gain since 1860. So to have two midterm gains in a row raises some eyebrows about the possibility that House elections may have changed in some fundamental way in the last eight years. Or maybe they just happen to be two exceptional years and not harbingers of real change.

But there is a reliable relationship between approval and seat change. Each percentage point of approval gained or lost by a president predicts about 1 more seat held or lost by his party in the House. At least when considering all midterms since 1946. By that count, President Bush's decline in approval from 42% to 33% since January should cost his party 9 seats. That's the bad news for Republicans.

But there are two problems with such estimates. The first is that House districts have become much more uncompetitive than in the past, and most analysts believe that the redistricting for 2002 produced some of the most partisan, and hence "safe", seats in history. If that is so, then the past may be a poor predictor of the future. Based on history, a president at 36.5% approval in April (where President Bush was), should expect to lose 45 seats in the House. That is wildly out of line with the best informed opinion which says that the Democrats will be very lucky to gain the 15 seats needed to take control of the House. A loss of 45 seats is far beyond anyone's current expectations. So one issue is whether the past is much of a guide to the current House. Those who know it best think the current House is too well insulated from electoral tides for such predictions to prove valid.

The second problem is the size of the variation in seat change given approval. In 1994, a president with an April approval of 51% found his party losing 54 seats in November. Less popular presidents Carter and Reagan (yes, really) both had April approvals of 44% in 1978 and 1982 but lost only 15 and 25 seats respectively. The variation around the blue regression line in the figure makes clear that for any given approval level, your actual results may vary. A lot.

For President Bush, with an April approval of 36.5 and a predicted seat loss of 45, this uncertainty translates into a range of predicted losses from the ridiculous (-74) to the plausible (-17). That range of uncertainty is so large as to be politically useless for estimating practical consequences. If you read forecasting models, look to see if they provide a confidence interval for their predictions. Most talk about their point prediction (xx seats) and a few about their R-square or the fit within the sample. But very few advertise their confidence intervals for the out of sample forecast. For good reason. It is almost always huge.

What if we cherry pick our data? In the graph above, I see 1946, 1958, 1966 and 1994 don't seem to fit with the rest of the data. If I drop these, then a line through the remaining points fits better and produces a slightly more plausible prediction of -30 seats (with a confidence interval of -45 to -16.) But this grossly overstates my true confidence! How do I know that 2006 will not be like 1958 or 1966 or 1994? Why not take out 1954 which now doesn't look so close to the line? For every decision I make like this, I actually ADD uncertainty to my true confidence interval, not take it away.

So what conclusion should we reach from presidential approval in the months leading to a midterm election? We have a very good basis for concluding that less approval means more seats lost. But the best estimates we can manage, given that we only have 14 elections with approval data, are so imprecise that their political implications are basically worthless. I'd bet a lot (ok, I don't bet so that's a cheap line) that the Republican party will lose seats in the House. And that the lower the President's approval rating, the worse they will do. But to put any meaningful confidence around a single point prediction (say, -15 seats or more) requires much more work and a good deal more calculation than just looking at the history of approval and seat change.

A number of political scientists and a few economists have developed models to forecast election results. Those use more than just approval, and achieve forecasts somewhat more precise than what is possible with approval alone. I'll be writing about those models, and estimating some of my own in the next few weeks. But keep your eye on the confidence interval. The uncertainty is larger than Democrats would like right now, and that's the good news for Republicans.

And to my (former?) friends who do forecasting: show me your confidence interval and I'll show you mine. I'll be happy to be proved wrong with legitimate tight intervals.


Click here to go to Table of Contents

Tuesday, May 09, 2006

CBS/NYT have Bush approval at 31%


The new CBS/NYT poll (appearing in tomorrow's papers) has approval of President Bush at 31% and disapproval at 63%. The 31% approval matches yesterday's Gallup/USAToday approval result. This represents an 11 percentage point decline since late January. In a CBS poll taken 4/28-30, just over a week earlier, approval stood at 33%. With this addition to the data, my model of approval trend estimates current approval to be 32.96% (the blue line in the figure above).

In approval by party identification, the new CBS/NYT finds 69% of Republican's approve, while 28% of Independents and 8% of Democrats do. That is quite close to Gallup's most recent approval by party id, 68/26/4%. I said here yesterday that I was surprised by the 13 percentage point drop in Gallup's Republican approval rate, and that I'd expect to see it rise a bit in the next poll. The CBS/NYT approval by party id has tended to produce somewhat lower approval rates among Republicans than has Gallup. So to find these in near agreement is a bit of a puzzle. The house effects usually put CBS/NYT 2.7% below Gallup, so for them to match overall approval is slightly unusual. I'd guess we will still see a bit of a rebound among Gallup Republicans and perhaps Gallup overall. However, the downturn in approval is at least continuing and perhaps slightly accelerating. So those Gallup Republican approval rates may well slip into the lower 70% range in the next week or two. (Or stay in the 60s as now, in which case I'm wrong and the White House is in for still worse times.)

The CBS/NYT data are full of bad news. On specific components of job approval, the president does even worse than his overall job rating: foreign affairs: 27%, economy: 28%, Iraq: 29%, gas prices: 13%, immigration: 26%, terrorism: 46%. Only the old standby of terrorism remains above 40, and even there dissapproval tops it, 46-48%. The gas price approval at 13% is quite astonishing. While reporters (including the NYT account of this poll) attributes the President's approval problems to Iraq, I find it hard to say which is the "cause": Iraq at 29, economy at 28, immigration at 26? It probably is true that the steady bad news from Iraq for over 3 years has been the leading anchor tied to the president's ratings, but at this point the public is about equally negative across the board. Indeed, one would have to ask "why as high as 31%" when the economy and Iraq are lower.

We haven't heard from ABC/WP or Pew lately. Likewise it has been a while for Time, Newsweek and the new LATimes/Bloomberg partnership. Now would be a good time to see if Gallup and CBS/NYT are harbingers of things to come, and what other polls are seeing in support among Republicans. Approval by party id is the crosstab to look for. By it hangs the tale.


Click here to go to Table of Contents

Monday, May 08, 2006

CNN puts Bush approval at 34%


A busy day for polling wraps up with a new CNN/Opinion Research Corp. poll taken 5/5-7/06 that finds approval at 34% and disapproval at 58%, up 2 percentage points from the 4/21-23.

This new result does little to change the trend line estimate, which stands at 33.5%. That CNN comes in close to trend is interesting simply because this new partnership of CNN/ORC has no track record of presidential approval ratings (ORC is long established but hasn't released previous readings of presidential approval. This is only their second poll for CNN.) Their first poll at 32% was a bit below the then-current trend estimate of 35% approval. With this result we gain a little sense that CNN/ORC may not produce a strongly negative house effect (reading approval below the average of other survey organizations.) But with only two polls, the jury is definitely still out on that.

CNN continues to post the results only for opinion questions and not demographics, a practice that makes assessment of polls problematic and which lacks honesty and transparancy with readers. CNN should change that policy.

I've talked about the polling today in two other posts, here and here. Nothing in the CNN poll leads me to change what I said earlier today about the Gallup/USAToday or Fox and AP Polls and their implications for the administration. Follow the links for that story.


Click here to go to Table of Contents

Approval slips to 31% in Gallup poll


The new Gallup poll, completed 5/5-7/06 finds a surprisingly low 31% approval rating for President Bush, with a 65% disapproval rate. That is easily the lowest reading by Gallup, and a 3 percentage point decline from the previous 34% on 4/28-30, itself a "new low". The effect of this new Gallup poll is to pull my current trend estimate down to 33.5%.

While Dems will be thrilled, we might withold judgement about this rating for a few days. At 3% below the trend line, this Gallup result does NOT qualify as an outlier, but it is far enough away from the trend line that I want to see if others pick up a similar sharp drop in approval. All but Fox are down, but this rate of drop in Gallup, if true, would signal a sharp increase in the rate of decline-- a drop of 3% in one week, compared to my estimated trend which is declining at 1% every two weeks. Gallup was also quite close to the estimated trend in their 4/28-30 poll, 34% in the poll compared to 34.2% for the trend estimate. So the large change, and the movement away from expectations, makes me think this one may be a bit lower than the trend can justify.

This is essentially the mirror of the Fox poll at 38% discussed here. Fox was quite a bit high, and I expect their next result to be lower. Gallup is 3% below trend, while Fox was 4% above. Neither is unbelievable but both are far enough away that we might expect some movement back to the trend, down for Fox and up for Gallup.

What is shocking in Gallup, and which may be a sampling fluke rather than a new trend, is that Republican support has fallen to only 68%, a shocking drop from 81% in the 4/28-30 poll and the mid-70s or above since January (The average in 2006 has been 80.5%). If this is real, it marks the beginning of the end of President Bush's reliable "base." Conservative discontent was found in the recent AP poll, and Susan Page in USAToday reports the new Gallup poll finds 52% approval among conservatives, in line with the AP poll. That said, a drop of 13% points in one week is hard to completely accept. At the same time, Gallup found a 5% UPTURN among independents, from 21% to 26% approval.

We hear rumbling about conservative discontent, and I think it is possible that the dam that has held firm for so long may be about to burst. If so, the flood will drown many congressional Republicans while leaving the administration struggling to exert influence of any kind. But before Dems start celebrating, and before analysts rush to interpret this too strongly, we should wait to see if that 68% Republican approval holds in the next Gallup sampling. I'd bet it returns to the low to mid 70s, still a substantial and significant decline, but not a 13% drop. If I win that bet, the President is still in trouble, and if I lose it-- run for the hills-- here comes the flood.

With these latest moves in approval, and with the midterm elections of some interest, the following graph of approval since FDR is more relevant than usual. President Bush is still not the most unpopular post war president, and he hasn't tested the 20s in approval yet. And given trends since 2004, it is easy to exaggerate his difficulties. However, the graph makes clear how he compares with previous presidents at similar times before mid-term elections. Not so good.


(The light blue vertical lines mark elections, each 24 months.)

This graph, based on Gallup data freely available at the Roper Center here, is also regularly updated and available in the link at the top-right of every page here, as "Presidential Approval from Roosevelt to Bush in Historical Perspective". It is updated as new polling is completed.


Click here to go to Table of Contents

Bush Approval: Up in Fox, Down in AP


A big 5% increase in approval of President Bush in the Fox News poll is accompanied by a 3% drop in the AP poll. The Fox poll, taken 5/2-3/06, found approval at 38% and disapproval at 53%. That compares to a 33-57 rating in Fox's 4/18-19 survey. When the 33% Fox result came out, I commented here that I thought it looked a bit low compared to my then current trend estimate of 35.4% and Fox's normal +.72 house effect. Now the new one looks a bit high. My current estimate is 34.3%, even INCLUDING Fox (and the recent Cook poll at 36%). So Fox at 38% looks beyond the usual margin of error by about a percentage point. Fox, in their story accompanying the poll, noted that this survey was more heavily Republican than usual (like most pollsters, they do NOT weight by party id, so it will naturally fluctuate from sample to sample.) That difference could have pushed the result slightly higher, though not by as much as is commonly assumed (see here.) So the rebound from 33% was to be expected. The 38% seems too high now, so I'll bet on another decline to about 34% in the next Fox poll (which should appear in a couple of weeks.) These movements of Fox are a good example of how polls mix "real change" with "random fluctuation due to sampling. Sometimes it is hard to distinguish one from the other, especially in a single survey organization over only two polls. My blue trend line estimates the signal while averaging over the noise in order to provide a better estimate of approval.

The AP, meanwhile, declined to 33% approval and 65% disapproval, down from 36-62% on 4/3-5. That too is a lot of movement, but the 4/3-5 poll was close to the trend, then 36.5 and the new poll at 33% is also close to the current trend of 34.3%. Because neither is very far from expectations, I don't have any reason to predict that AP will do other than follow the overall trend in the next month.

This discussion points out how much we should expect polls to fluctuate around my trend estimate due to random sampling, measurement error, and the effects of small but ideosyncratic events (as opposed to major events that lead to durable change.) Looking back over the past 16 months, since January 2005, half of all polls have come within +/- 1.5% of my trend estimate. 80% of all polls have been within +/- 3%, and 90% have been within +/- 3.7%.

Note that that track record reveals more variation than sampling error alone would predict. Most of these polls have a sampling margin of error of about +/- 3%. In that case, we should expect 95% of polls to be within +/-3% of my trend, when in fact we only find 80% within that range. This discrepancy is due to non-sampling fluctuation, due to house effects, question wording, low response rates that induce additional randomness, and perhaps even the weighting of results back to population averages when the people so weighted may not be fully representative of the group. As response rates have declined, weighting may be inducing more randomness from poll to poll even as it "fixes" possible bias due to under-representation of some groups in the sample. For whatever reason, these data show that the polls are not by any means "terrible", but that the sampling based margin of error over-states their precision by a significant amount.

As for the President's approval ratings, despite the upturn in the Fox poll, the balance of results continue to be disappointing. The Cook poll at 36% was 2nd highest of these, but Cook was continuing a downward trend from January. No other recent poll besides Fox has found a poll-to-poll increase. As the trend line in the graph makes clear, so far the downward trend remains unabated. And the scariest thing for Republicans is the report in the AP poll that conservatives have reduced their support. If Republican support shrinks from it's unusally high levels (given overall approval, see here), then there is room for considerably more decline still.

I have yet to see a full week of good news for the White House--- something stressing competence and leadership success. Mr. Goss' resignation and a controversial nomination of General Michael V. Hayden to replace him at CIA looks to provoke disagreement between the White House and Congressional Republican leaders that can only further the damage. If Goss' resignation is a prelude to a new scandal, then the news outlook is even worse.

Watch the numbers on Republican and Independent support. If these move down it will be time to start looking for the first sub-30% approval ratings. So far President Bush has maintained Republican support above 75%, and usually above 80% (These are Gallup numbers, other polls have found more variation in Republican support). After a brief dip last month to the mid-70s, Republicans rose to 81% approval in the April 30 Gallup poll. Independents, meanwhile, have fluctuated in the mid-20s, after climbing to the mid-30s in January.

Some writers say that approval can't decline because Bush's "base" will remain solid. I think that is not the case. You can continue to be a strong conservative yet reach the conclusion that this administration simply has proven unable to accomplish its (and your) goals. The AP finding of low conservative support illustrates this. It is for that reason that support can decline yet not substantially improve Democratic prospects in November. Major losses among Republican supporters might translate into lower turnout but not into more Democratic votes. Further damage due to low approval will come from Republican candidates and incumbents abandoning the President, not due to Republican voters shifting party preferences.


Click here to go to Table of Contents

Tuesday, May 02, 2006

Midterm Presidential Approval and 2006


Updated with correction and new graphs at bottom of the post, 5/5.

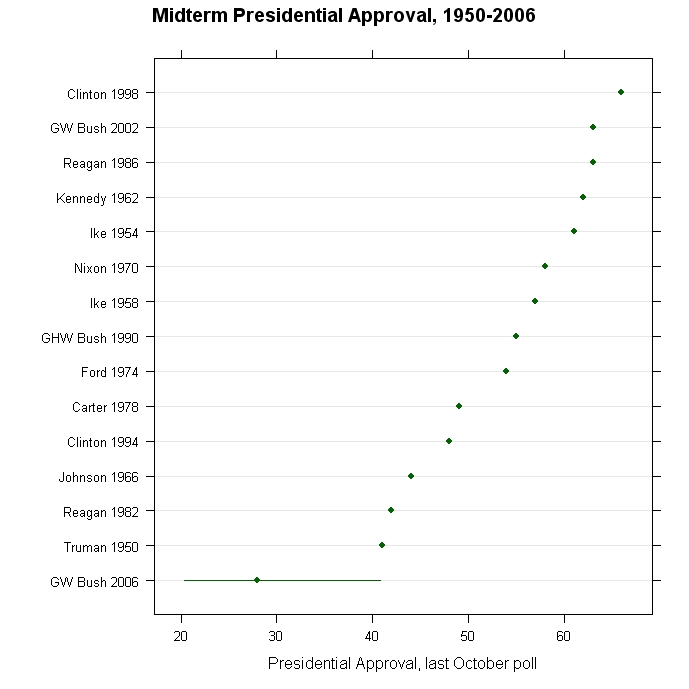
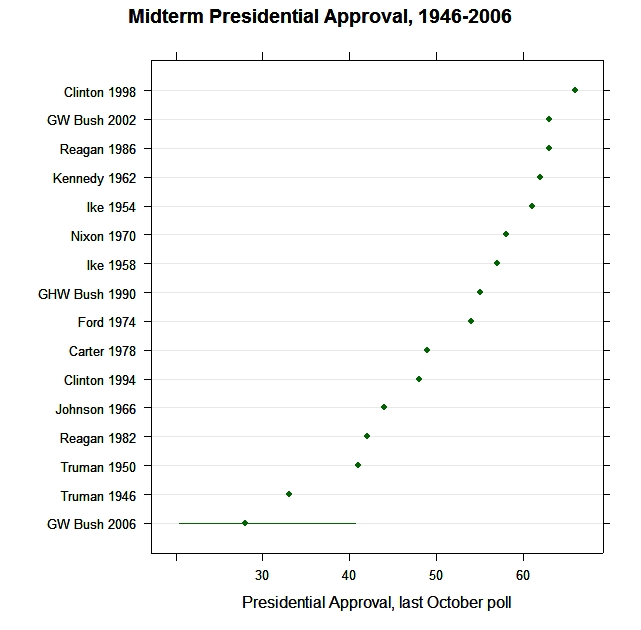
President Bush's approval rating is on course to set a record low for mid-term elections. The magnitude of the problem is greater than commonly perceived. The previous record low approval in the last Gallup poll of October was 41% for President Truman in 1950. Based on approval trends in 2005-06, the President and Congressional Republicans are facing an election day 2006 approval of between 20.4% and 40.8%. (The range is highlighted in the graph for 2006. The "dot" is the estimate based on the trend in most of 2005, which is less than half the current rate of decline.)

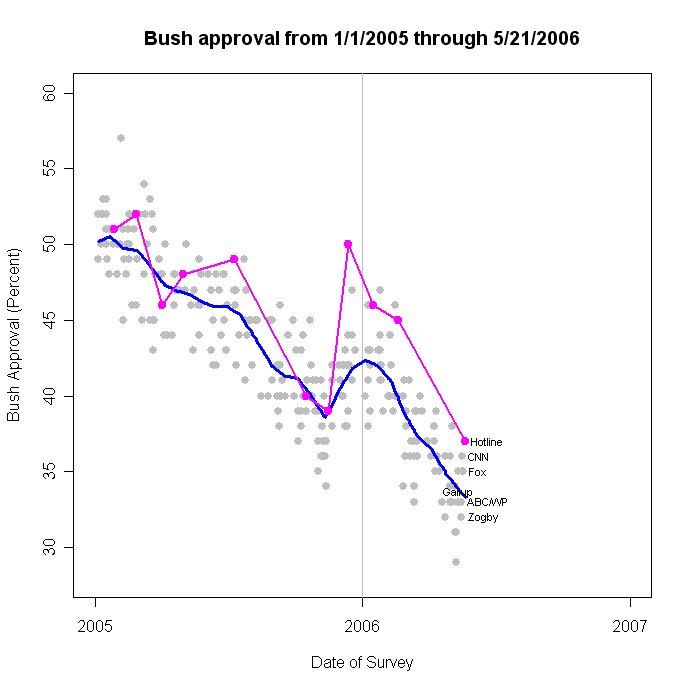
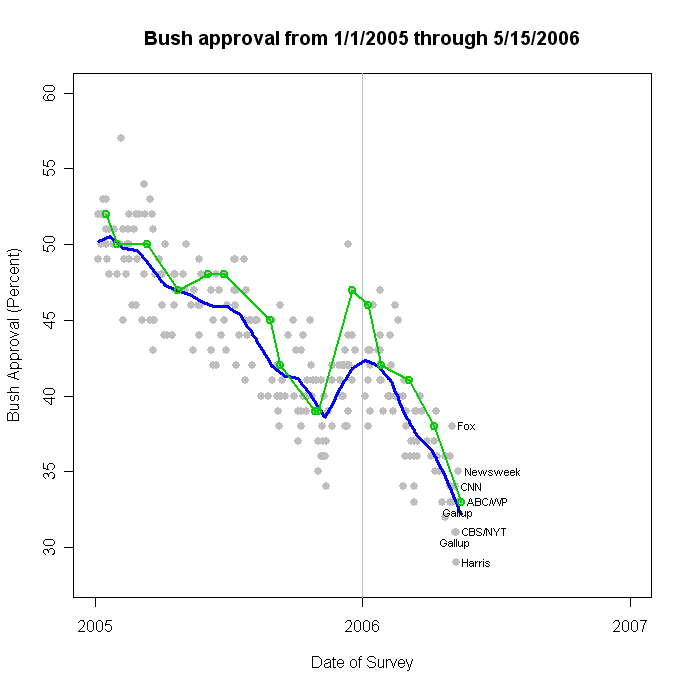
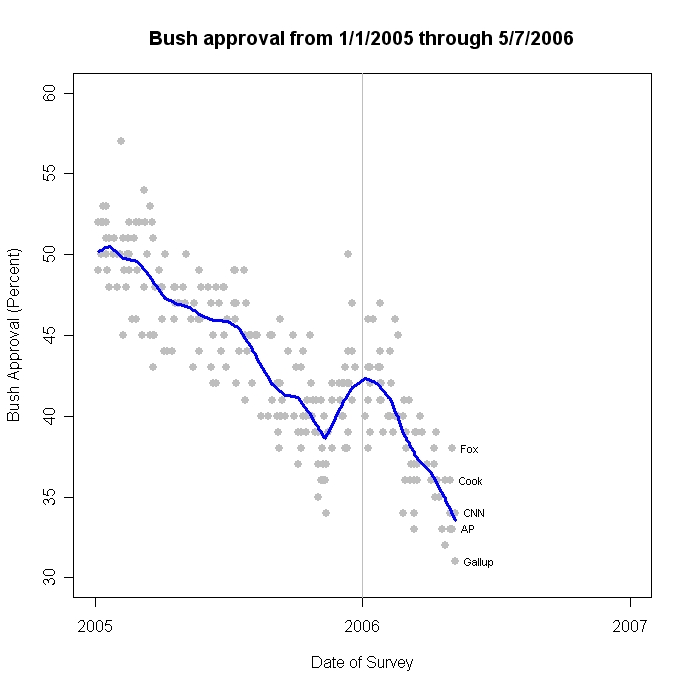
During January 1, 2005-April 30, 2006, the president's approval has trended at three rates. From 1/1/05-11/11/05, I estimate a decline of -0.0309% per day (there were also shocks of -1.3% for Katrina and -1.9% for the Libby indictment but these didn't change the rate of decline.) From 11/11/05-1/31/06 my estimate is approval gains of +0.0362% per day. Since February 1, 2006 the trend has again turned negative, at -0.072% per day, the most serious rate of decline in the Bush administration.

To put these in persepctive, in the first 11 months of 2005, approval declined 1% every 32.3 days. During November-January it rose 1% every 27.6 days. Since February approval has fallen 1% every 13.9 days, or over twice the rate of most of 2005.

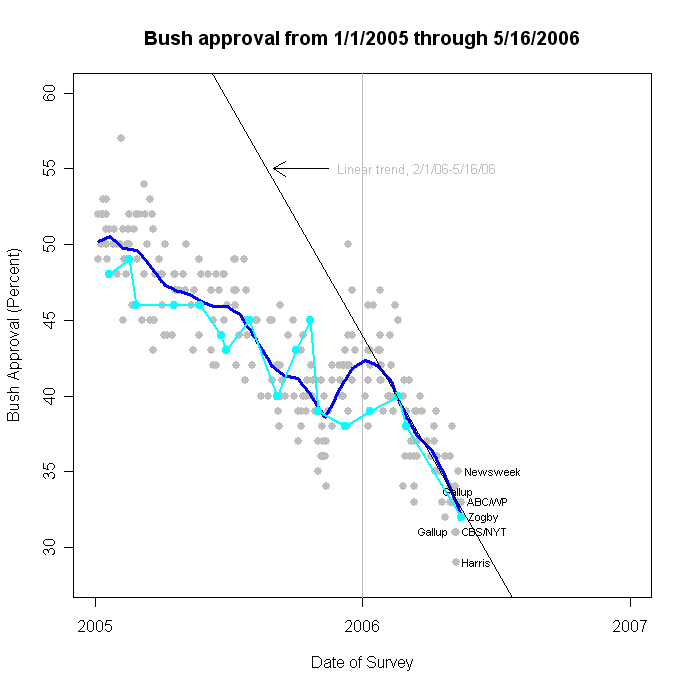
Given these rates, we can estimate approval as of the midterm election on November 7, 2006, 189 days from today.

If the current rate were sustained throughout the year, approval would stand at 20.4% on election day, below the all time low of 22% for Truman. (Gallup cites 23% as Truman's low, and they should know, but there is a February 1952 Gallup poll that appears to show the 22% I cite. I'm trying to get this clarified. Either way Bush would be below Truman's record.)

If the rest of the year returned to the rate of most of 2005, -.0309 rather than -.0720, then election day approval would be 28.1%.

If the president can rally and sustain the same rate as during November-January, then election day approval would be 40.8%.

Sustained improvement in presidential approval has not been seen in the Bush administration except during the 2004 election campaign period. From 5/1/2004 through 11/2/2004 approval rose at a rate of +0.0112% per day (or +1% every 89 days.) At that rate, approval at the midterm would stand at 36.1%.

And, of course, if approval simply stabilizes at the current level, approval would be 34% on election day.

Approval can surge dramatically, as the aftermath of 9/11 and the start of the Iraq war illustrate. However, such surges commonly accompany dramatic international events and not new domestic initiatives. By their nature, such events are unpredictable. The surge in support is also usually short-lived.

I was frankly shocked at the above results. Other presidents have suffered low approval ratings, and President Bush still stands above the lows of four of the ten other post-war presidents. But I had not appreciated how much the current approval is below other mid-term approval ratings, even without extrapolating current trends. We have simply never seen a president this unpopular going into a midterm election.

I will be surprised if the current rate of decline continues. But I will also be surprised by a sustained upturn at the rate of November-January. Either would be an extreme outcome. But approval between the upper 20s and lower 30s seems entirely plausible. There is no precedent for a midterm with approval at those levels.


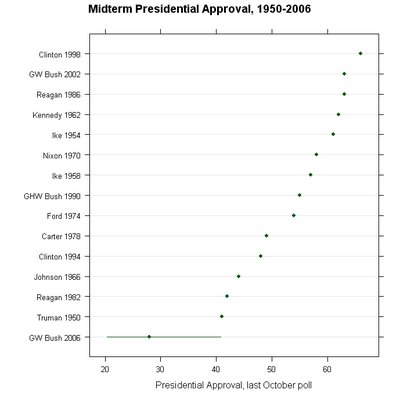
UPDATE (5/5): Anonymous pointed out in the first comment below that Truman in 1946 had a 33% approval rating in September 1946 and 34% in November. No October poll was conducted. I left that election out because 1946 is commonly treated as part of the "war years". Political scientists usually exclude the war years from elections models because the war makes them atypical, and I did so without really thinking about it for that reason. However, Anonymous' point is well taken and including that year is an important corrective to my claim that "There is no precedent..." for midterm approval as low as President Bush's current level. So amend that to read "almost no precedent", and thanks to Anonymous for making the point. Also while Ford was relatively popular in October 1974, Nixon in May of '74 was at 25%, which surely had more to do with Republican fortunes that year than did President Ford. (David T makes this point in a comment below.)

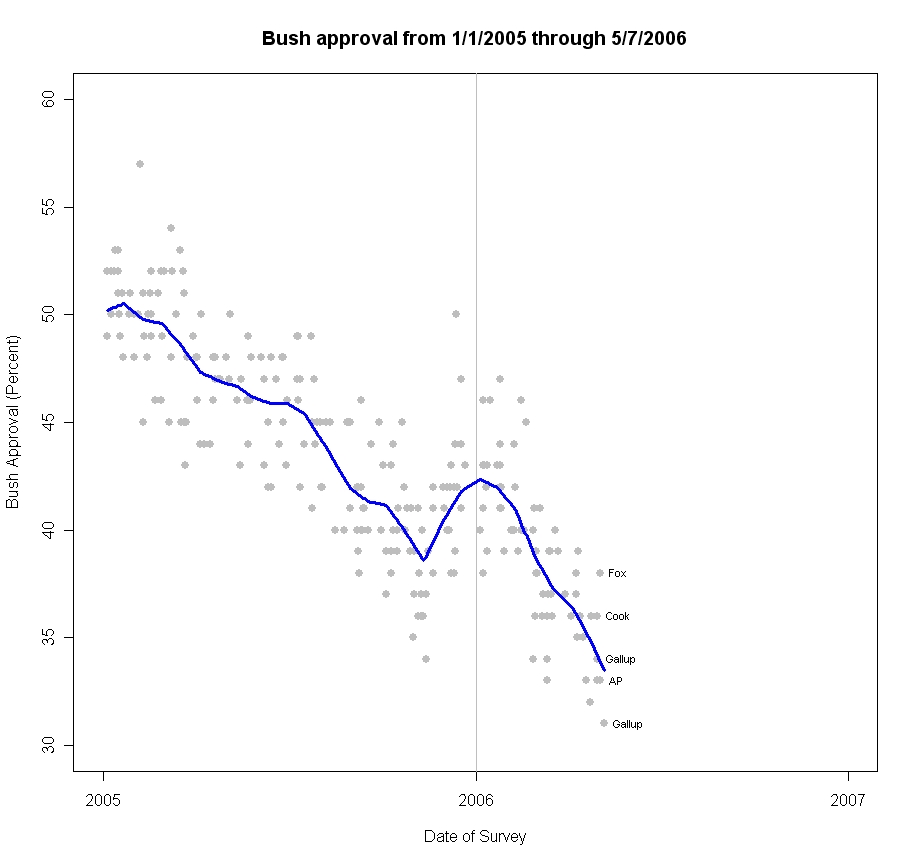
Here is the updated graph WITH 1946 included. As you can see, the range of plausible Bush approval is still mostly below even that low Truman 1946 figure, though there is the possibility that President Bush recovers enough to have October readings above Truman 1946.


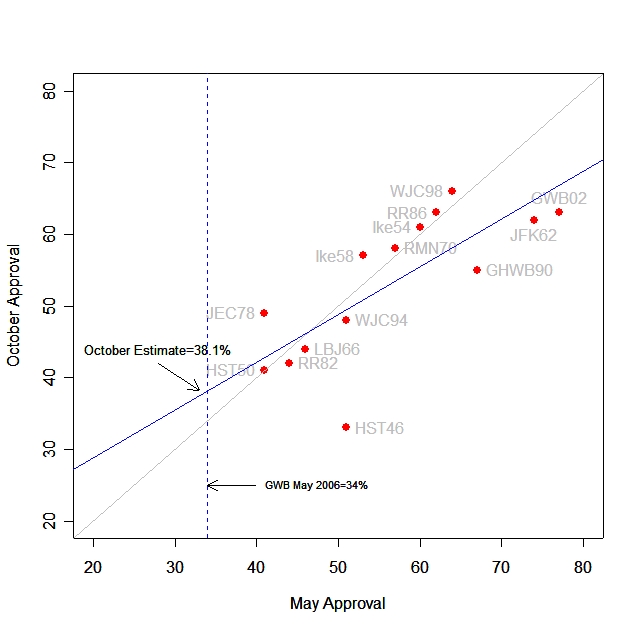
In another comment (and they are all quite good-- worth reading!) Apol asked what we could estimate of October approval based on May approval. As it happens I had just put that graph together and here it.


While May approval does predict October approval the fit is far from perfect. The gray diagonal line provides a reference for where October is exactly equal to May. The solid blue line shows the regression line that estimates the best fit between May and October. The slope of that line is less than 1.0, indicating the presidents with very high May approval tend to fall, while those with low approval in May tend to rise. This is called "regression to the mean" in statistics, and is not necessarily due to some substantive political process at work. However, this fit does provide some encouraging news for the White House. Given May approval of 34%, the estimated October approval would be 38.1%. A not huge but certainly welcome move up for Republicans. I hasten to add though that the uncertainty in this estimate is so large as to be virtually useless: a 90% confidence interval is +/- 13%, so somewhere between 25 and 51%!

If you abandon statistics (did I say that??) notice that JFK62 and GWB02 are both coming off crisis rallies and GHWB90 had just abandoned his "read my lips, no new taxes" pledge. If you also let me take 1946 out, then the rest of the cases lie very close to the diagonal line, suggesting that May is a much better predictor of October for most presidents, the exceptions being in the aftermath of a crises or broken campaign pledge. Of course the danger of this kind of nonstatistical analysis is that it is easy to think of a reason to take out cases selectively to bolster your case.

So I'll go back to my original analysis based on the trends in 2005-06. The range of values shown for GWB06 in the dotplots, from about 20% to about 40% represent what I believe are the plausible limits of either further decline OR substantial recovery, and either of those extremes would be surprising to me. So I'd still say that approval in the high 20s to low 30s would seem most plausible, given the trend in approval over the past 16 months. And that remains bad news for Republicans and hopeful news for Democrats. Republicans need some serious successes before November, and Democrats need an attractive alternative platform to take advantage of Republican weakness.


Click here to go to Table of Contents

Bush approval at 34% in Gallup, 33% in CBS polls


New polls from Gallup and CBS provide evidence that President Bush's approval rating continues to erode. Gallup/USAToday's 4/28-30/06 poll finds 34% approval and 63% disapproval, while CBS's survey, also conducted 4/28-30 finds 33% approval and 58% disapproval. Both polls are below my estimate from last week of 35% approval. With the addition of these two new polls, my trend estimate now stands at 33.98% approval. UPDATE 5/2, 9:26 pm: Cook/RT strategies poll is out: 36% approve, 59% disapprove. Cook has a +1.48 house effect, so with that removed they are at 34.52%-- no real change to the estimates presented here. All the results below do NOT include the Cook poll but should not be much affected by it.

From January to mid-November 2005, my linear trend model estimates President Bush lost -.0309% approval per day, or one percent every 32.4 days. From November through January, he reversed this decline, gaining +.0362% per day, or a point every 27.6 days. However, since the State of the Union address, his decline has been -.0720% per day, or one percent each 13.9 days. That is a devastating rate of decline, which would put the President's approval at 20.4% on election day 2006, below the all time low of 22% for President Truman. On the other hand, if the White House could duplicate the positive momentum they sustained from November 11 through January, the president could gain 6.8% by election day, for 40.8% approval on November 7.

Given that the current rate of decline is the most rapid of the Bush presidency, it seems unlikely to be sustained throughout the rest of the year. Still, even if the rate for the rest of the 189 days until the election returns to the rate of most of 2005, the model would predict approval of only 28% on election day. A sustained rally of the "base", coupled with continued decline among independents, would produce approval of 30-33%. In other words, only a significant reversal of fortune, such as in November-January, seems likely to produce an election day approval near 40%.

Gallup and CBS report somewhat different results by party identification. Gallup finds Republican support at 81%, Independents at 21% and Democrats at 6%. Those are new lows for Independents and Democrats but an upturn in support among Republicans, whose suport had been 74% and 78% in two earlier April surveys. Thus the decline from 36% to 34% in the Gallup results are due to still further decline among Democrats (from 11 to 6%) and Independents (from 26% to 21%).

CBS arrives at almost the same overall approval (33% vs 34%) with lower Republican support but higher Independent approval. CBS finds 68% approval among Republicans, down from 77% on 4/6-9, and 32% approval among independents, UP from 24% in the earlier survey. Democratic support fell from 12% to 6%.

It is hard to understand the apparent rise in Independent approval at a time when overall approval continues down. Even if we go back to the CBS poll of 3/9-12/06 which registered a 34% overall approval, we still see an improvement in approval among independents from 28% in March to the current 32%. (Accompanied by a drop in Republican approval from 74% to 68%, while Dems held steady at 6% in both polls).

The Gallup and CBS party id questions differ (see my earlier post here on house effects on party id). Both get 35% Dem, but CBS has Reps at 27% vs Gallup's 30% and Independents at 37% vs Gallup's 34%. If we make the (rather bold) assumption that the difference is due to question wording that leads CBS to classify about 3% as independents who Gallup's question would put into "Republican", then this would have the effect of raising Bush support among CBS Independents, which we see. However, you'd also expect it to raise the loyalty rate of the remaining 27% CBS Republicans, which is not what we see.

An alternative would be that CBS's question stresses "Generally speaking, do you usually think of yourself as a Republican, Democrat..." while Gallup stresses "In politics, as of today,...". Those who, "as of today" are still Republican's might be more loyal supporters of the president, while indpendents would include people who "as of today" no longer feel Republican because of poor performance. That would square with Gallups higher Rep. support and lower Ind. support.

For CBS, the story would have to be that the long-term Republicans ("generally speaking...usually think of yourself as...") would include more who are unhappy with the president's performance but remain "generally" Republican, hence producing a lower rating with that group. The higher rating among independents would then have to be because they don't include as many disaffected Reps who have become short term independents. That sort of works but is still hard to square with the higher number of Independents in CBS compared to Gallup.

Also note that with subgroups of this size the margin of error is relatively huge: +/- 6 or 7% for each partisan group. Still, the movement of CBS independents is a puzzle. (Yes, you can make up a post hoc explanation, but for independent support to move up when both Reps AND Dems move down is not what we'd expect to generally occur.)

Bottom line: the trend continues to be bad for the White House and for Congressional Republicans. Unless the rate of decline is arrested soon, presidential approval at the mid-term election will be by far the worst in post-World War II history. (I'm preparing a separate post on approval at midterm. I'll link here when it is ready.--It is up now. Click here.)


Click here to go to Table of Contents