Friday, June 30, 2006

Third Poll Agrees: Approval at 41%, LA Times


The third poll in two days has checked in with an approval rating of 41%. The LA Times/Bloomberg poll has approval at 41%, disapproval at 56%. The 41% matches polls by Hotline and Fox that were released yesterday. The LATimes poll was conducted 6/24-27, while the Hotline was done 6/21-25 and Fox 6/27-28. Gallup and ABC/WP produced polls ending 6/25 with approval at 37% and 38% respectively.

The addition of the LATimes brings my estimated approval trend to 38.98%, exactly a 5 point gain from the low of 33.98% on May 12. President Bush's approval rating fell from a 2006 high of 42.34% on January 5, losing 8.36% over 128 days, a rate of one point each 15.3 days. From May 15 to June 28 he has gained one point each 9.0 days, an impressive rate of gain.

This sharp turnaround in approval makes forecasting approval in November even more uncertain that it was before. In May we faced an unprecedented low in approval going into a midterm election. The current approval remains low, but is far from the historically unprecedented lows that seemed possible a month and a half ago. The uncertainty remains, however, as to how long this upward trend will last, and then what? Beats me, but it is going to be fun to watch.


Click here to go to Table of Contents

Thursday, June 29, 2006

Puzzling PA Polls Pondered


Last week two new polls on the Pennsylvania Senate race came out on the same day. Quinnipiac University saw the race 52%-34%, a stunning 18 point margin for Democratic State Treasurer Robert Casey over incumbent Republican Senator Rick Santorum. On the same day, the Wall Street Journal released it's latest Zogby Interactive "Battlegrounds" poll showing the race at 47.9%-41.3%, a 6.6 percentage point Casey lead Zogby says is within the margin of error. Anyway you count it, that is a striking discrepancy between polls (even if we allow that they both agree Casey seems to be ahead.) So a reasonable person asks "What is going on here and how can I make sense of these crazy polls?"

I touched here on the importance of looking at polls in the context of all the available polling on a race. The Pennsylvania polls show just how revealing this can be. What appears a hard to reconcile discrepancy is actually pretty clear once we look at all the data.

(A side issue is that Zogby Interactive polls are based on volunteers from the internet rather than a random sample of the population. The data are then weighted to resemble the population in partisan and demographic terms. However, with no probability sample, there is no theoretical justification for computing a margin of error for such polls, and their reliability remain open to much doubt and discussion. I'll pass today on getting into those matters and just talk about the performance of the Zogby poll.)

The figure above shows all the trial heat polls for Pennsylvania since January 1, 2005. The solid lines are the estimated trends across all the polling. After apparent Casey gains and Santorum losses in the first half of 2005, there has been a small decline for Casey and a small rise of Santorum, though Casey continues to hold a clear advantage.

How do the Quinnipiac and Zogby polls fit with this overall trend? The triangles represent Quinnipiac polls. They cluster fairly closely to the estimated trend for Casey, but appear to pretty consistently underestimate support for Santorum compared to the estimated trend. And the latest Quinnipiac poll moved substantially further below the estimated trend for Santorum than previous polls. At the same time the latest Quinnipiac poll appears clearly above the trend for Casey. Combined, these two discrepancies amount to a substantial overstatement of the Casey lead.

At the same time, the Zogby polls (the square symbols) track the Casey vote fairly closely but OVERstate the Santorum vote by a bit. The latest Zogby is slightly above the Santorum trend and a couple of points below the Casey trend. So Zogby understates the margin between the two at the same time Quinnipiac overstates that margin. The result is a very large discrepancy between the two polls, and a considerable puzzlement for campaign observers.

There are a couple of details we could consider. First, the trend line is not very sensitive to whether we include Quinnipiac and Zogby or not, at least once enough other pollsters get involved in the polling, midway through 2005. After that the dashed line, excluding Quinnipiac and Zogby, tracks closely with the solid line based on all the polling. Roughly, the Quinnipiac and Zogby "house effects" cancel each other out in the estimated trend based on all the polls.

Second, the magnitude of the "house effects" is pretty noticeable. Quinnipiac's mean deviation from the trend is -2.49% for Santorum and +0.58% for Casey. Zogby reverses this: +3.05% for Santorum and -0.56% for Casey. Put those together and Quinnipiac overstates Casey's lead by +3.07 points while Zogby understates it by -3.63%. The difference between the two polls would then be 6.7 percentage points on the margin between candidates-- quite a noticeable discrepancy.

The graph below highlights how these two polls fare relative to other polling in the race. The x-axis is the difference between each poll and the trend estimate when the poll was taken. Negative values mean the poll underestimates the trend, while positive values means it overestimates the trend. The y-axis is the same discrepancy for Santorum. The vertical and horzontal lines in the graph mark zero, or polling that falls exactly on the trends for each candidate.


The triangular symbols for Quinnipiac polls shows that they have mostly fallen into the lower right quadrant, overstating Casey and understating Santorum. Worse, the most recent poll by Quinnipiac (circled) is quite far away from the trend, producing an estimate that is even further from the poll's average house effect. Three of the earlier Quinnipiac polls were quite close to trend for both candidates (they are close to the intersection of the "zero" lines in the graph.) But there has been a strong pattern of Quinnipiac results that are well below trend for Santorum while a bit above for Casey.

The Zogby polls have generally been well above the Santorum trend, while only a little low on Casey. The most recent Zogby poll is actually closer to both trends than has been the case with most of his polling in this race.

So that is the solution to the puzzle of the Pennsylvania polls. When compared to all the polling, the discrepancies become rather clear. Both polls have been discrepant and in opposite directions, on average. The latest results exaggerate this already clear tendency, with the quite discrepant Quinnipiac poll far from the estimated trends. When the two polls appear on the same day, this conflict is more apparent than when they are released well apart.

Bottom line: I much prefer my trend estimates, which use all the available polling information. Those trends currently stand at 49.7% for Casey and 40.4% for Santorum.


Click here to go to Table of Contents

Bush approval continues up: Fox 41, Hotline 41


New polls by Fox News and by the Hotline both place approval of President Bush at 41%. The Fox poll was taken 6/27-28/06 and finds disapproval at 50%. The Hotline poll was taken 6/21-25/06 and puts disapproval at 56%. Both of these polls are a little over 3 points above the current trend estimate (the dark blue line) of 38.6% approval, a 4.6 point rise from the low of 34% on May 12.

The Hotline has run "hot" on Bush approval for a while now, but Fox is normally less than a percentage point above the average across all polls. So while the readings here are a tad higher than I would estimate, neither is outside the usual margin of my estimated trend. Certainly neither appear to be statistical "outliers".

There is also, for the first time, a hint that approval may be accelerating its upward trend. The blue trend line appears to be moving up a bit faster than in earlier estimates. The change is not large, but bears watching and a little more analysis.


Click here to go to Table of Contents

Tuesday, June 27, 2006

Bush approval: Gallup 37%, ABC/WP 38%


New polling by Gallup (6/23-25/06) and ABC/Washington Post (6/22-25/06) agree on an approval rating around 37-38%. Gallup estimates approval at 37%, with disapproval at 60%, while ABC/WP puts approval at 38% and disapproval at 60%. The estimated trend in approval remains solidly upward sloping (the dark blue line), with a current approval estimate of 37.2%, now up 3.2 percentage points from the all time low estimate for President Bush of 33.98% on May 12.

At least to my eye, there is no evidence yet that the upward trend has changed slope in the last three weeks, or since the upward trend began on May 15. (The dynamics between May 15 and June 8 are difficult to estimate precisely due to relatively few polls, but the upward trend has remained clear with the additional polls taken since June 8 when Zarqawi's death was announced.

My take on this remains that there was little or no apparent "bounce" due specifically to Zarqawi's killing, but that the upward trend in approval began with President Bush's more active engagement with immigration following his May 15 speech, and that trend has been further supported by Zarqawi and Bush's trips.

If my claim is correct, that Bush's immigration position is in fact widely supported by the public (contra the Republican House leadership's position) and that that fact coupled with Bush's leadership on the issue was the stimulus for his improved ratings, then the House leadership's decision to abandon the President on this issue presents new problems for the White House.
Another failed presidential initiative, especially one that had majority (and bipartisan) PUBLIC support, should not help approval ratings in the next few weeks.

The White House has been rather quiet on this issue in the face of the House Republican's slap in the face. Perhaps they believe the issue has been successfully shifted to Iraq and, surprisingly, to the President's benefit in the wake of Zarqawi and the House and Senate votes against "cut and run" proposals. I remain skeptical of that. Iraq appears to me (based on the data) to remain a net negative for the President, even if it can command strong winning majorities in both houses. That reflects a Democratic weakness in congress (and perhaps on the campaign trail), but not necessarily a presidential strength with voters. So I'd bet that increased emphasis on Iraq is more likely to drag down presidential approval in the long run. In the short term, the upturn is based more on immigration and less on Iraq, but the two have become confounded by events which may have led Republican leaders onto an unfortunate course, at least for the White House.


Click here to go to Table of Contents

Thursday, June 22, 2006

Bush approval at 36% in Zogby poll


The Zogby poll, taken 6/15-20/06, finds approval of President Bush at 36% with disapproval at 64%. This puts Zogby close to the estimated trend (blue line) which stands at 36.6%.

The previous Zogby poll, taken 6/2-6, just before the killing of Zarqawi, found 31% approval. Zogby interprets this five point gain as a "bounce" for Bush due to Zarqawi and the Bush trip to Iraq:
After what some have called the “best week of the President’s second term” in office, George W. Bush’s job approval numbers have jumped significantly to 36%, as a nation hungry for good news out of Iraq was finally served a morsel, a new Zogby International poll shows.
I beg to differ with this interpretation. The 6/2-6 Zogby poll was well below the trend, and indeed moved down from a previous Zogby poll while the trend was clearly already moving up in early June. Zogby therefore compares an abnormally low approval rating of 31% (4.5 points below the then current trend estimate of 35.5% approval.) The new estimate of 36% is now only slightly below the current trend estimate of 36.6%. Rather than consider this a bounce for Bush, I would say that the new poll represents a return to the trend after an unusually low reading (in the sense of being well below the then-current trend.) To attribute this gain in approval to events seems to ignore the discrepancy of the 6/2-6 poll compared to other polling.

There has been considerable interest in both the media and the blog world about a possible Zarqawi/trip to Iraq bounce. I think virtually all analyses have missed the mark. So far there is very little evidence that the killing of Zarqawi or the trip produced a bounce-- a jump in approval due to the event AND above the current trend. Despite this, reporting of most polls have compared previous with current polls and attributed all of the change to the success in killing Zarqawi. None of the reporting I've seen has recognized that there is an upward trend in approval, beginning May 15, and that improvement in approval is at least as likely to be due to that trend as to the Zarqawi event. At the same time, Democratic leaning blogs have attacked the reported bounce while seemingly ignoring or denying the evident upturn in approval that is now just over a month old. They are probably right that there was not a large bounce after June 7th, but they are wrong to deny that approval is significantly up. By my trend estimate, approval is now up 2.6% since it's low point on May 12 of 33.98%.

It is a mistake by the MSM to confound a politically crucial change in trend with a single event-based "bounce". It is also a mistake by Democratic bloggers to focus on denying the bounce while failing to admit that approval is now moving up. The former owe news consumers smarter analysis and the latter need to deal with things as they are and not as they might wish them to be. Strategy based on denial is not likely to be the most effective.


Click here to go to Table of Contents

Tuesday, June 20, 2006

Pew finds Bush approval at 36%


A new Pew Research Center poll taken 6/14-19/06 finds approval of President Bush to have risen 3 percentage points since the last Pew Poll, to 36%. Disapproval stands at 54% in the poll. This new data point is consistent with the continued upturn in approval. My local trend estimate is now 36.6% (the blue line in the figure), continuing the upward trend in approval.

The previous Pew poll, at 33%, was based on an unusually long field period, from 4/27-5/22, a period which includes the point at which approval appears to have started moving up after May 15. As a result, the previous poll mixes some data from the downward trend period with some from the new upward trend. If we take the midpoint of the field period as the effective data of the poll, that would suggest approval around 33% on May 9, just before approval started to rise. That is also consistent with my estimated trend about that time, if a point or two below the trend.

The previous positive trend in approval lasted for a little more than two and a half months from November 11 to the first of February, and marked about a four point upturn in my trend estimate. So far, approval has turned up about 2.5 percentage points in just over a month.


Click here to go to Table of Contents

Saturday, June 17, 2006

Up, down or unchanged: Describing poll results


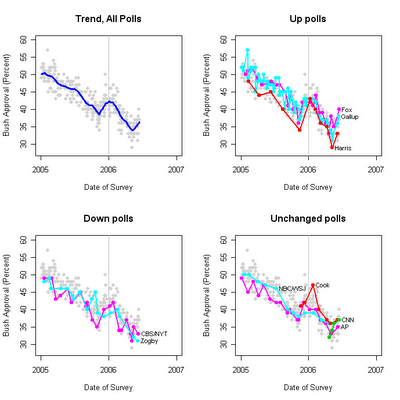
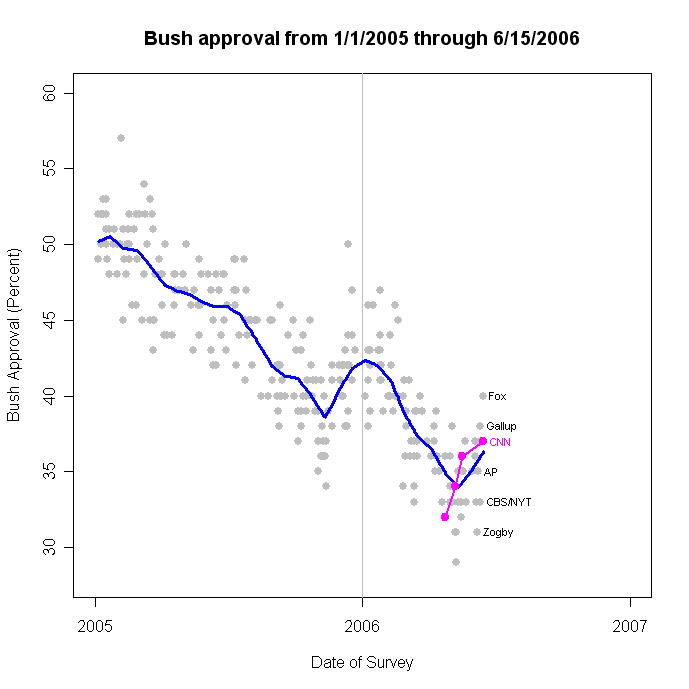
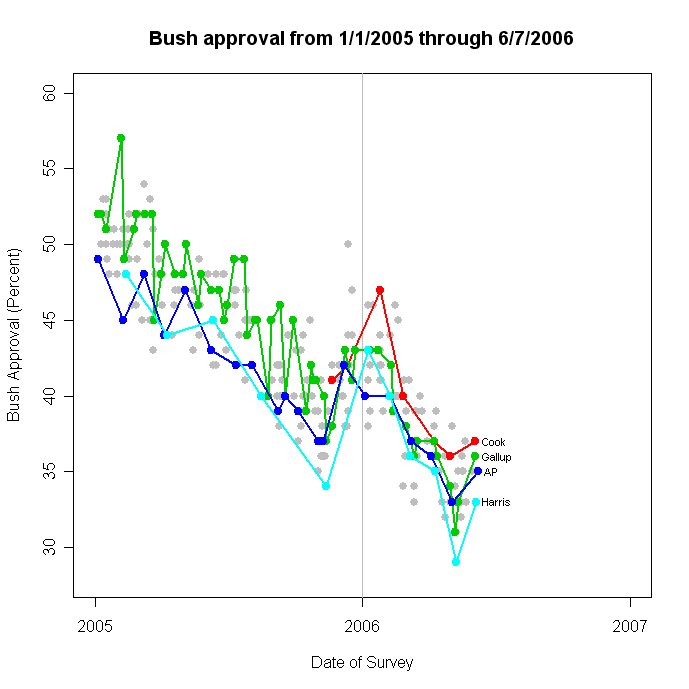
Since June 1 there have been 10 new polls released. As luck would have it, five were taken before and five after the killing of Iraqi al-Quada leader Zarqawi. The data continue to support an upturn in approval of President Bush (see the blue line in the top left figure). But what have the news reports had to say about these polls? How do the statistical results get described and interpreted by the press and by those who conduct the polls?

I was prompted to look at this by what seemed to be a cacophony of conflicting headlines. You can read about 1500 of them by following this link to search results from Google News. Depending on the headline you find that either approval is up or down or unchanged. Thanks.

The fact is that there is some apparent conflict among the polls taken in the first two weeks of June. Two showed slight declines from previous polls in presidential approval (CBS, Zogby), five showed gains of 1 or 2 percentage points (Cook, NBC/WSJ, CNN, USAToday/Gallup, and AP) and three found gains of 3-5 percentage points (USAToday/Gallup, Harris and Fox). This has provided fodder for those who wish to argue for "no real change, just a blip" and for those who argue "Bush is back big time."

Yet of the 10 polls, only two actually found a statistically significant change from the previous poll by the same survey organization. Fox's 5 point gain was highly significant (p=.028), and Harris' 4 point gain just barely failed to reach significance (p=.053) but I'll give it credit by rounding down. The p-values for all the rest were not close to statistical significance: .64, .64, .16, .35, .45, .34, .63 and .65. So IF ONE ONLY COMPARES adjacent polls by the same pollster, eight of these ten organizations should have reported "no change". (See my post here on the perils of this approach to measuring change.)

The IF here is important. In all but one of the initial accounts of these polls, the news organization or pollster refers ONLY to previous polls by the same organization. In characterizing change, therefore, they act as if there were no other evidence for either a rise, fall or stable approval level. If one takes that seriously as a statistical standard, then the tests above are the appropriate measure of whether the changes are easily explained as random variation or if there is enough evidence of change to reject random noise as the explanation. In 8 of the 10 cases, the conclusion should have been "no change."

Here are the ways in which the organizations characterized these polls, sorted in descending order of change. These are brief but direct quotes, not paraphrases. Fuller quotes and links to entire stories follows at the end of this post.

+5 Fox: "out of the thirties", "up 5 percentage points to 40"

+4 Harris: "Rises Slightly", "risen from 29 percent in May to 33"

+3 USAToday/Gallup (6/1-4): "For the second straight time ... edged higher", "now five percentage points above its low"

+2 USAToday/Gallup (6/9-11): "Poll sees a boost for Bush", "going up to 38% from 36%"

+2 AP: "35 percent, essentially unchanged from his rating of 33 percent last month"

+1 CNN: "hasn't budged", "virtually the same", "However ... has risen since late April"

+1 NBC/WSJ: "slightly improved", "remains below 40", "baby bounce", "changed next to nothing", "slight tick up"

+1 Cook: (No direct characterization of approval trend.)

-1 Zogby: "we see him at 31%" ... "lowest we have ever had for him", "coalition of supporters ... is crumbling."

-2 CBS: "done little to ... boost President Bush's approval ratings", "Zarqawi's killing hasn't helped" "remains just 33 percent-- down slightly from 35 percent"


There are several interesting comparisons here. First, the tone of the characterization is generally cautious: "slightly" and "edges" for gains of 4 or 3 points. Fox, with the strongest statistical evidence, actually avoided adjectives of magnitude in favor of "out of the thirties" and "up 5 percentage points", both descriptively accurate.

USAToday/Gallup and AP seem to differ in how big a 2 point gain is. USAToday/Gallup: "Poll sees boost", AP: "essentially unchanged". Neither is close to statistically significant, but the implication of the descriptions are quite different.

CNN and NBC/WSJ characterize their 1 point increases in minimalist terms: "hasn't budged", "virtually the same", "slightly improved", "changed next to nothing". In contrast Zogby reads a one point decline as "lowest we have ever had him", which is literally correct, if not statistically significantly different from the previous Zogby reading.

CBS, with a 2 point decline, minimizes the magnitude of change with "down slightly".

In the full articles, some of these use comparisons to earlier polling to point out that approval has risen more compared to earlier in the spring, again making comparisons only with their own polling. That context is important. However it isn't enough.

And so, if we read the stories, we should come away with an impression of only a "slight rise" or an "edging up", AT MOST. We would also be justified in concluding that there has been only minimal increase or a loss if we read the words of five of the poll descriptions. Four would make us believe there is some upward movement (though two of these four are not statistically significant changes.) In short, ambiguous evidence of at most small gains.

And yet, the evidence, when pooled across all polls throughout the year, is quite unequivocal: approval started moving up after May 15. The blue estimated approval trend in the top left plot marks a very sharp turnaround after that date, and estimates a gain of about 2.3 points in the past month. The strength of this analysis is that it draws on ALL the available polls, rather than make pair-wise comparisons with previous polls of the same company. This also recognizes the substantial amount of random variation around the trend, reminding us that individual polls are subject to quite a bit of variation that has nothing to do with the "true" level of presidential approval. Noise happens, but when we estimate the trend across all the polls we get better, more precise estimates of approval.

In part, the news organizations are handicapped by their sponsorship of polling. CNN wants to quote only CNN polls, and CBS acts as if NBC didn't do polling. There are obvious business reasons for doing so, but it limits the writing reporters can do. This is especially true because the reporters are, of course, quite aware of what other polls are showing. Some are even aware of what my blue trend line is estimating approval to be. Yet they are constrained to write "what the new poll shows" without the benefit of putting it into the context of what other polling shows. The result is that reporters either literally report the poll's results without the more helpful broader perspective, or they color their choice of adjectives in light of other evidence, which remains uncited. (In very rare cases, they actually do point to other trends, or more commonly interview pollsters who can be quoted providing the context.)

Yet on the whole, I think the characterizations we find in these 10 polls largely misses the big story of mid-May to mid-June, 2006. After three and a half months of continuous decline, President Bush has constructed a sudden and clear upturn in public support. That should be the story here. And, in fact, political reporters NOT constrained to write about the polls, have been saying that loudly for the last week or so. (And see the Charlie Cook quote below, which neatly captures the story.) But not so much with the poll stories. Ironically the best evidence for the upturn is the aggregation of those poll results, even though individually the poll stories only weakly suggest an improvement.

I suppose I should be grateful for this commercial limitation on news organizations' ability to write about other companies' polls. It is exactly the niche that PoliticalArithmetik fills, as does the polling collected by RealClearPolitics and PollingReport. But having said that, news organizations need to find ways to provide better perspective and analysis of trends that are clearly visible, if only when aggregated across organizations.


Here are the fuller quotes describing each poll, and links to the full stories. I've tried to locate the organization's OWN description of their results, rather than news stories written by others about the results. Again, I follow descending order of changes from previous polls.


Fox (6/13-14/06 poll): Published 6/15/06

06/15/06 FOX News Poll: Victories in Iraq, Bush Approval Up

... President George W. Bush’s job approval rating is out of the thirties for the first time since February and currently stands at 40 percent. ...

President Bush’s approval rating is up 5 percentage points to 40 percent this month, up from 35 percent approval in mid-May. Just over half of Americans disapprove (52 percent).

Much of the increase in support comes from the president’s party. Fully 82 percent of Republicans say they approve of Bush’s job performance, up from 71 percent last month and a low of 66 percent in April. Overall, the president hit a record low of 33 percent approval in April 18-19.


Harris (6/2-5/06 poll): Published 6/9/06

President Bush’s Approval Rating Rises Slightly from All-Time Low
Just over one-quarter of U.S. adults believe the country is going in the right direction

After reaching an all-time low last month, President Bush’s job approval rating has risen from 29 percent in May to 33 percent this month. Two-thirds of U.S. adults have a negative view of the President’s job performance.


USAToday/Gallup (6/1-4 poll): Published 6/6/06

Note: This was published in the "On Deadline" blog. Google did not find a full news story based on this poll.

Bush's approval rating notches second rise

For the second straight time, President Bush's approval rating has edged higher in the USA TODAY/Gallup poll. It is now five percentage points above its low.

The latest reading: 36% of the 1,002 adults polled over the weekend said they approve of the way he is "handling his job as president." That's up from 33% who said that in a May 8-11 poll and 31% - Bush's low in the USA TODAY/Gallup poll - in a May 5-7 survey.

The surveys each have margins of error of +/- three percentage points. At 36%, Bush's approval rating has now edged higher than its possible "range" of 28%-34% in the May 5-7 survey. (Of course, there is a chance - given the margin of error - that his current approval rating is 33%. But Gallup's pollsters do not believe that is likely.)


USAToday/Gallup (6/9-11 poll): Published 6/13/06


Poll sees a boost for Bush, Iraq war

The survey, taken Friday to Sunday and released Monday, also showed Bush's approval rating going up to 38% from 36% earlier this month and an all-time low of 31% in May.


AP (6/5-7/06 poll): Published 6/9/06

Poll: Many Support Troops, but Not the War


The survey also found that the war continues to take a toll on the public's opinion of Bush. Approval of the president was at 35 percent, essentially unchanged from his rating of 33 percent last month based on the poll's margin of error of 3 percentage points.


CNN (6/14-15/06 poll): Published 6/16/06

Poll: Bush's unpopularity could hurt GOP candidates

President Bush's continued unpopularity could present a challenge for Republican candidates in this fall's mid-term elections, according to a new CNN poll released Friday.

The poll results weren't all bad news for Bush. After his surprise visit to Baghdad, Americans were slightly less critical of his handling of the war in Iraq, but his overall job approval rating hasn't budged, the poll shows.

...

In the poll, conducted on Wednesday and Thursday by Opinion Research Corp., the president's overall job approval rating was at 37 percent. In May, before his trip to Baghdad, it was virtually the same: 36 percent.

However, Bush's approval number has risen since late April, when it was just 32 percent.


NBC/WSJ (6/9-12/06 poll): Published 6/15/06

Bush’s standing rises slightly

After a week of positive news for the White House-- including the death of terrorist leader Abu Musab al-Zarqawi and the formation of a new government in Iraq-- the latest NBC News/Wall Street Journal poll finds that President Bush's standing has slightly improved, especially when it
comes to the situation in Iraq.

...

Democratic pollster Peter D. Hart, who conducted this survey with Republican pollster Bill McInturff, calls the results a "baby bounce" for Bush. "The death of Zarqawi may have improved attitudes about ... the war," he says. "But I think it changed next to nothing toward the overall attitudes about the president ... and the upcoming elections."

McInturff agrees. "You can see a slight tick up. But you don't see any influence on Bush as of yet."

According to the poll, 37 percent approve of Bush's job performance-- an increase of one point since the last survey in April. This is the seventh straight NBC/Journal poll that has had Bush's job approval below 40 percent.


Cook Political Report/RT Strategies (6/1-4/06 poll): Published 6/16/06

(Note: Cook did not directly write about presidential approval based on the Cook/RT poll other than to report the topline results. A subsequent power point presentation of the results showed the trend but commented on the overall negativity rather than the 2% rise in approval. Cook's characterization of the state of approval is not based solely on the Cook/RT Strategies poll, which is probably why it is such a good analysis.)

Pride Before The Fall?

Perhaps the irony in all of this Democratic victory clucking is that it is happening at a time when the president's freefall in the polls has stopped and he has even regained a couple of points.

It was just a few weeks ago that most polls showed job-approval ratings in the low 30s; now most are in the 35 to 38 percent range. While these numbers are still terrible, they are no longer dropping.


Zogby (6/2-6/06 poll): Published 6/9/06

Poll: "Had enough?" Not Enough to Lift Congressional Dems to Power

"Clearly a weakness that the Republicans have is President Bush. In this poll, when we look at President Bush, not only do we see him at 31% positive overall job performance rating, which is lowest we have ever had for him, but we also see the coalition of supporters who supported his election and reelection is crumbling. He wins just a 48% positive job approval among born-again Christians, but we also see lows among conservatives, Republicans, veterans, WalMart shoppers, and among NASCAR fans. Right now, the President is a burden for the Republican Party heading into the midterm elections."


CBS (6/10-11/06 poll): Published 6/12/06

Poll: Bush's Ratings Remain Low

The death of Abu Musab al-Zarqawi has done little to improve views of how things are going for the U.S. in Iraq or boost President Bush's approval ratings, a CBS News poll finds.

Zarqawi's killing hasn't helped President Bush with the public, either. His overall job approval rating remains just 33 percent-- down slightly from 35 percent last month-- while 60 percent disapprove.

------------------------------------------

Click here to go to Table of Contents

Bush approval rise continues: CNN 37%


President Bush's approval rating continues up in the latest CNN/ORC poll taken 6/14-15/06. The new poll has approval at 37% and disapproval at 53%, a one point rise in approval and a four point decline in disapproval.

Since Opinion Research Corporation (ORC) took on the CNN polling in April, approval has risen five percentage points in the CNN/ORC polls.

With the new data point my estimated approval trend (the blue line) stands at 36.3%. At the low point of all time Bush approval, polling completed on May 12, my estimate was 33.98%, so the increase since the President's immigration address has been 2.3% in just over 1 month. That is a healthy rate of increase. In the November 2005-January 2006 rally, Bush's estimated approval rose by 2.7% in the month between November 11 and December 11. For comparison, approval fell by 2.2% in the month preceding November 11, and by 1.8% in the month before May 15. Thus the White House is making up ground at a little better rate than they were losing it over the spring. Whether the rally can be sustained long term is, of course, the $64,000 question.

These recent changes have also demonstrated how uncertain any prediction of approval in November is. When I wrote about that here, I estimated a range of approval anywhere between 20.4% and 40.8%, a huge range. If the current rate of increase were sustained, the President would be around 47% approval by election day, and even wider range.

The history of approval of President Bush has shown few periods of sustained rallies. The period from early 2004 through election day was the single most prolonged gain since he took office. However, that runup amounted to only a total of 5 percentage points, from 46% early in the year to 51% just after the election. The current rate of rise is much steeper but sustaining it over four and a half months would be unprecedented in this administration.

So the uncertainty about November approval looks bigger than ever. There is still a long way for approval to climb before the President could again be considered "popular" (except among Republicans), but the trend is certainly far better for Republicans than what they faced before May 15.


Click here to go to Table of Contents

Thursday, June 15, 2006

Approval continues up: NBC/WSJ 37%, Fox 40%


New polling by Fox and NBC/Wall Street Journal support a continued rise in approval of President Bush. The NBC/WSJ poll, taken 6/9-12/06 found approval at 37% and disapproval at 58%. That was a gain of 1 percentage point over the NBC/WSJ poll of 4/21-24. The Fox News poll taken 6/13-14/06 placed approval at 40%, disapproval at 52%. That was a 5 point gain in apprvoal compared to Fox's last poll taken 5/16-18.

My local regression estimate of approval (the blue line) now stands at 36.1%. While Fox and Gallup have registered recent gains of 7 percentage points from their lows, the estimated trend is up only about 2 points since mid-May.

The NBC/WSJ poll has been surprisingly unresponsive to approval dynamics since November 2005. After tracking the estimated trend quite well throughout 2005, the NBC/WSJ polls have failed to move in tandem with the movements since November. So far as I know there haven't been changes in the NBC/WSJ methodology, so perhaps this is just noise in a handfull of polls, but the shift is nonetheless striking. In a period that the estimated trend has moved over 8 points, NBC/WSJ has covered only 3 points.

The current jump of 5 points in Fox is the opposite issue. That move far outruns the estimated trend's movement since May 15. (Gallup has covered a similar range, up 7 points since it's low in early May.) I suppose it is inevitable that some will question Fox's high reading of approval. But check the estimated house effects in this post. Fox normally runs only 0.72 percentage points above the average approval poll. This reading is substantially higher than that, almost 4 points above the estimated trend. I expect that's some sampling error. Four polls ago, Fox had a result 3 points below the trend (33% on 4/18-19/06). Both that result and today's 4 points above trend are consistent with the amount of random variation we see in the polls, so there is simply no case to be made that this Fox poll is "unrealistically" high on Bush approval. At the same time, I think my trend's estimate of 36.1% is a more reasonable estimate of approval than Fox's 40. The recent polls have ranged from Zogby's 31% to CBS' 33, AP's 35, NBC/WSJ's 37, Gallup's 38 and now Fox's 40.

What remains unknown is whether the killing of Zarqawi will produce any "bounce" in approval beyond that due to the upward trend started on May 15. A number of stories have attibuted the change in recent polls to the Zarqawi death. But that (stupidly) ignores that change was already underway. What is required is an estimate of BOTH the upward trend starting May 15 AND a possible bounce occurring on June 8th. So far there really aren't enough polls to reliably estimate the Zarqawi bounce, and with relatively few polls between May 15 and June 8 it may not be possible to get a good estimate of the two effects. But we'll see when ... "more polls come in."


Click here to go to Table of Contents

Tuesday, June 13, 2006

SurveyUSA finds approval up to 37%


SurveyUSA's 50 state tracker for June is now out. They find an increase in approval from May to June in 42 of the 50 states, with a national estimate rising from 33% in early May to 37% as of the polls taken 6/9-11/06, following the death of Zarqawi. Despite the move up in approval, President Bush's approval ratings remain below 50% in 45 of the 50 states.


Median approval (the horizontal line inside the red box in the figure above) rose from 35% in May to 37.5% in June, the first upturn since January. The median state approval now matches the values of April and March, but remain well below the median of 43% from January or the high of 45% in June and July of 2005. SurveyUSA's 50 state tracking polls began in May 2005, so no earlier data are available.


The shift from May to June approval was essentially uniform across most states. The blue local regression line is essentially parallel to the 45-degree line for about 43 states. This shows that for these states, the expected gain in approval was the same, with some random variation. For the seven states with the highest May approval, gains were smaller, with the blue line for expected gain approaching the 45-degree line in the upper right portion of the data. Over all states, the median gain was 3.0% (mean was 2.94%). For the 43 states with approval below 45% in May, the median gain was 4% (mean 3.47%) while for the 7 states above 45% in May the median gain was just 1% (mean was -0.29%).


If we compare June to January, we see that the decline in support in the first half of 2006 has been roughly uniform as well. The blue line is not perfectly parallel to the 45-degree line, but it is close enough, and straight enough, that I think the big picture here is that support declined by close the same exptected amount. The median decline was -5% (mean -4.54%).

This pattern of roughly uniform shifts in approval across the states is interesting. It implies that both "red" and "blue" states are about equally affected by the President's shifting performance levels. While a more refined statistical model might pick out some differences, the overall qualitative impression of the changes is that all states shift by about the same average amount from month to month.

To see this, try the animated graphic linked to here. (I couldn't get Blogger to provide a very good image of it, so decided to let dedicated readers who get this far just link to the full resolution version. If the resolution doesn't look good try clicking again on the image to enlarge it to full resolution.) This animation shows approval in each month since June 2005 plotted against the initial May 2005 approval level. The striking thing is that the blue local regression remains pretty much parallel to the 45 degree line across all months, despite considerable shifts in the level of approval over time. Again, there are some minor variations in that story, but overall the striking thing is that there is no "loyal core" that remains high, nor a group of "Bush haters" who are always very negative. Rather it looks like a strong case of uniform national swings in approval. The animation makes clear the small rise in June and July 2005 followed by the substantial declines through November, then a rise back to near May 2005 levels through January 2006 followed by a hard decline through the spring. Whether June marks the beginning of a new upturn, comparable to November-January, or not, remains to be seen. The suspense makes getting up in the morning worth while!


Click here to go to Table of Contents

Regular readers will know that I remain undecided on the automated interviews conducted by SurveyUSA. On the positive side, they begin with a perfectly good random sample of phone numbers, which is far better (I think) than using a non-random group of volunteers for internet based polling. On the other hand, the response rate is quite low so that initial nice random sample now depends on the characteristics of the non-respondents, a huge majority of the original sample. SurveyUSA rightly points out that conventional telephone samples suffer from quite bad response rates too, though not quite as low as the automated systems. SurveyUSA has been unusally open and willing to discuss these matters in professional presentations and on their web site, which I think is a huge plus. But no matter what the technology, high non-response is a threat to any probability sample. So far, the results look pretty well in line with other data and with election outcomes. If the decision to respond is independent of the responses to items (such as approval) then we can get away with low response rates. But if such a correlation should develop, the results will be biased. That is the concern with automated surveys especially because of their low response rates, but it is not irrelevant to conventional telephone surveys with live interviewers either. So I'll use these, and sincerely thank SurveyUSA for making these data available on their site for all to see. But some caution is still needed.

The sponsors of the SurveyUSA 50 state tracking poll are:

KAAL-TV KAAL-TV KABC-TV KATU-TV KATU-TV KCTV-TV KCTV-TV KEYE-TV
KFOR-TV KGTV-TV KHON-TV KING-TV KOB-TV KPIX-TV KPNX-TV KSAX-TV
KSDK-TV KSDK-TV KSL-TV KSTP-TV KTHV-TV KUSA-TV KVBC-TV KWCH-TV
KXTV-TV WABC-TV WABC-TV WABC-TV WBIR-TV WBZ-TV WBZ-TV WCAU-TV
WCAU-TV WCAU-TV WCPO-TV WCPO-TV WCPO-TV WCSC-TV WCSH-TV WDBJ-TV
WDIO-TV WDIO-TV WDIV-TV WFLA-TV WFMY-TV WFOR-TV WGRZ-TV WHAS-TV
WHAS-TV WHEC-TV WKRG-TV WKRG-TV WKYC-TV WLBZ-TV WLNE-TV WLTX-TV
WMAR-TV WNYT-TV WOAI-TV WPTV-TV WTLV-TV WTLV-TV WTVD-TV WUSA-TV
WUSA-TV WUSA-TV WXIA-TV WXIN-TV WYTV-TV WZZM-TV


Click here to go to Table of Contents

Bush approval continues rise in Gallup to 38%


A Gallup poll completed 6/9-11/06 in the immediate aftermath of the death of Iraqi al-Qaeda leader Zarqawi finds approval of President Bush continues to climb. The Gallup results find approval at 38%, with disapproval at 56%. That is a 2 percentage point increase since Gallup's poll a week earlier (6/1-4). More impressive are the gains in approval since Gallup's all time low of 31% approval as of 5/5-7/06.

That seven point gain is quite substantial, no doubt music to the White House ears. It is also a bit too good to be entirely true. The slope of Gallup approval in the figure is considerably sharper than the slope of the blue trend line estimate of approval. Gallup's low of 31% was actually the second lowest of the polls taken about that time, and some 3 percentage points below the then-current trend estimate. The current estimate at 38% is now at the high end of polls taken since June 1. So this seven point gain is almost certainly an overstatement of the "real" gains made by the President since his May 15 address on immigration, which marked a turning point for his recent approval ratings.

Nonetheless, the new Gallup data continues to support the evidence that the President is recovering from his all time low approval ratings of April and early May. With the Gallup data added, my trend estimate stands at 35.0%. That is also a nice upturn from the estimate with the CBS and Zogby data (but not the new Gallup) which stood at 34.4% (that was about 30 minutes ago, before the Gallup data was released on the USAToday website!)

I commented just before the Gallup data were released here that we would want to see some more polling before accepting the downturns in approval registered by Zogby and CBS. The Gallup data help bring the estimated trend back up. As it now stands, we have four recent polls showing approval at or above 35% (AP, Cook and two Gallups), while three polls find approval below 35 (CBS, Zogby and Harris). My trend estimate (the blue line in the figure) reflects the balance across these pretty well.

What we still need more polls for is to help estimate the current rate of gain in approval. At the moment it appears to be less sharp that that registered in November-December 2005, though the Gallup jumps are similar then and now. If more polls come in above 35% approval then the trend line will rise further. If the new polls include some more results similar to CBS, then the trend will remain somewhat flatter than in November. And of course if more polling looks like Gallup's latest then the trend will look sharp indeed.

There is more in the Gallup data that bears close inspection. USAToday is to commended for posting a quite complete set of topline results here. Not all organizations are as forthcoming with their data.

Gallup registered substantial and widespread increases in elements of presidential evaluation in this poll. Approval of President Bush's handling of Iraq improved to 36% from 32% as of 4/28-30/06. Approval of his handling of terrorism improved to 51% from 48% over the same time. Handling foreign policy was up to 39% from 33%. And approval of his handling of the economy reached 39%, up from 34%.

My personal favorite, however, is approval of Bush's handling of immigration. That rose to 38% from just 26% as of 4/28-30. Since December, the data have consistently shown that substantial shares of the population are broadly supportive of immigration reform of the kind the President has supported-- increased border security but coupled with some form of guest worker program and a path to citizenship for illegal immigrants already in the US. That has been a lightening rod for House Republicans who have loudly embraced only tightened border security and criminal penalties for illegals. But I think the data have strongly suggested that the President actually holds the winning hand on these policies despite the reaction of conservative talk radio in addition to the House Republicans. So I find the 12 point upturn in approval on immigration to be a good sign that the public has in fact respondent favorably to the President's leadership on this issue. Whether that leadership can in fact broker a deal with the House is another matter. But I think positive polling trends in approval, and continued evidence that the public is generally quite receptive to the President's position on immigration, may yet bring over significant numbers of House Republicans.

Other results in the Gallup data find increases in support for the Iraq war ("A mistake" down to 51% from 57%; Iraq going moderately or very well up to 47% from 38%; US will definitely or probably win up to 48% from 39%) and a small reduction in support for speedy withdrawal ("immediately" or "within 12 months" down to 49% from 54%.)

These results for Iraq should be understood to reflect not just the impact of Zarqawi's death put also the success of the new Iraqi government. They should also not be overstated so long as over half think the war was a mistake and nearly half want a speedy withdrawal.

The CBS results found smaller increases in support, but did register some gains related to Iraq. Even as CBS found overall approval down two points, they found approval of the President's handling of Iraq up 2 points and handling of terrorism up 1 point. (And contra the Gallup finding, CBS finds a DECLINE in support for handing of immigration-- to 33% from 38%, much to my dismay.) But CBS also finds an increase in saying the Iraq war is worth the cost, from 25% to 33%, and that the war is going very or somewhat well is up to 43% from 41%. And those saying the US is either very or somewhat likely to succeed in Iraq is up to a frankly surprising 60% from 55% in early May.

So even the CBS poll that was down in overall approval contained elements of good news for the White House. (With the appropriate caveats that the LEVEL of support is generally still quite low, but that the TREND is somewhat improved.)

More polls (where have I said that before) will help clarify this. CNN/ORC has a new poll on Iraq that finds modest improvements similar to Gallup's, though they don't offer a presidential job approval in the 6/12 data release. Maybe Tuesday.

Taken together, the data have enough positive elements (even in CBS, but gangbusters in Gallup) to sustain the upward trend in approval ratings.


Click here to go to Table of Contents

Monday, June 12, 2006

Approval down in CBS, Zogby, bucking trend


Two polls, one completed just before and the other just after the death of Iraqi al-Qaeda leader Abu Musab al-Zarqawi, find small declines in approval of President Bush, a finding that runs counter to most recent polling trends. The Zogby poll, taken 6/2-6/06 found approval at 31% and disapproval at 67%. That was a 1 percentage point decline from the previous Zogby poll in mid-May. The CBS News poll taken 6/10-11/06 just after Zarqawi's death, found approval at 33% and disapproval at 60%, a 2 percentage point decline since CBS's previous poll in mid-May.

These results run counter to four recent polls by Gallup, Cook, AP and Harris, each of which had registered gains in approval in late May and the first few days of June.

Adding these two new polls also brings down the gains in my estimated approval model. That model, the blue line in the figure, now stands at 34.4%. Prior to adding these new polls, it was at 35.2%. That 34.4% would still represent a modest upturn since early May, but not so large as the previous estimate. The red line in the graph is my "more sensitive" model. Now that the standard blue line has enough data to work with, there are only minor discrepancies between the two estimates.

What is surprising about these two polls is that they represent a decline from previous polls by the same organization. Most recent polling since May 15 when President Bush spoke to a prime time audience on immigration has found small but steady increases in approval, when compared to the same poll's previous readings.

It is also a surprise that the CBS poll, taken after Zarqawi's death, shows a downturn. One would normally expect a positive "bounce" after such a military success. Such bounces are often short lived, but to see no bounce, or especially a negative one, runs counter to much past experience. It is possible that the potential charges against U.S. Marines for the incident at Haditha have had a negative effect that is countering the positive Zarqawi effect, but if so any effect of Haditha had not made itself apparent in previous polling.

It is worth noting that neither the Zogby or CBS results represent statistically significant changes from their previous values. And, as they go against the recent trends in a number of other polls, I'm inclined to view their results with caution.

I expect we'll see several new polls this week in response to Zarqawi's death. They should help us decide if these two polls are a fluke or represent a change in the President's previous upward momentum. For the moment at least, my model continues to point up, if less steeply than before. If I were a betting man, I'd bet on further upturns in other polling. But then, I never bet.


Click here to go to Table of Contents

Friday, June 09, 2006

Bush approval still up: AP +2%, Harris +4%


President Bush's approval rating continues to show gains in two new polls. The Harris poll, taken 6/2-5/06 finds a four point increase to 33% approval, with 67% disapproval. The AP/Ipsos poll taken 6/5-7/06 finds a two point gain to 35% approval and 63% disapproval.

After adding these new results, my approval trend estimate (the blue line) stands at 35.2% approval. The more sensitive (but less conservative) red line estimate now registers 35.4% approval. These two estimates are now converging as the blue-line estimator has enough polls to work with.

It is useful to also take an "apples to apples" look at the polling trends. The figure below shows the tracks of each of the four most recent polls. All four show upturns since early May, ranging from just one point in Cook to five points in Gallup. Individually these shifts fall short of statistical significance (a fact noted in the AP story here.) But as I've explained in a previous post here, poll to poll changes will often fall short of statistical significance. By using all the polls for my estimated trend, we get a better picture of what is happening to approval than we do if we myopically focus on poll-to-poll changes and their significance.


I've been stressing the change in direction of presidential approval. That seems to me to be the interesting development here. Democrats may prefer to focus on the still very large disapproval numbers, and the fact that even improvement to 35.2% approval is still historically poor approval levels. But both sides should keep their eye on the November prize. It isn't where President Bush stands today that matters for the fall elections so much as where his current trajectory seems likely to put him by November. A month ago it looks like he would be in the 20s. If the last 21 days of trend is continued, he could be in the 40s. In short, the range of potential approval levels I plotted a while back (here) is still about the range of potential approval. The current change just makes it a lot more interesting to watch what happens!

And of course, we'll now shift our attention to the impact the death of insurgent leader Abu Musab al-Zarqawi may have on presidential approval. The capture of Saddam Hussein produced about a 5 point rally in approval, though it was rather short lived. I'm confident we'll see some new polls by Monday or Tuesday that will help us start to estimate whether this Iraq success has similar effects on approval. Stay tuned.

--------------------------------------------------

Blogger continued to have problems and wouldn't let me post this yesterday afternoon. On the other hand, the Harris numbers came in in the meantime, so this post contains two new polls.


Click here to go to Table of Contents

Wednesday, June 07, 2006

Bush approval on rise: Cook at 37%


President Bush's approval ratings continue to improve with the addition of the latest Cook/RT Strategies poll, taken 6/1-4/06. The poll of 874 registered voters finds 37% approve and 57% disapprove of the job the President is doing. That is just a 1 percentage point improvement from Cook's 4/27-30/06 reading, but it reverses a series of declines in the Cook poll. More important for my purposes, with the addition of this poll, even my "conservative" trend estimate (the blue line in the figure above) is now clearly moving up. As of yesterday, with Quinnipiac and Gallup added, the trend estimate had flattened. Now there is a slight upturn. The current (conservative) estimate is that approval stands at 34.8%, up from 34.1% without the Cook data.

If I switch to the less conservative red line (but beware! it is also more easily fooled by short term noise!) then the upward trend is more pronounced, showing a gain of close to 3 percentage points since the low point in early May. (See yesterday's post for more discussion of these alternative estimates.) The red line estimate of approval now stands at 36.6% approval, up from yesterday's 36.3%.

As I said in earlier posts here and here, the conservative model takes some 6-12 new polls to be "sure" of a change in direction. And, of course, this new trend may or may not last. But the evidence is now strong enough to conclude that there has been a change in trend. We've not seen such a change since early February. I pointed out in an earlier post that the trend from February through April had been extremely close to linear, without evidence of any rallies, even short term ones. That linear trend has now clearly ended. Whatever is ahead, I will certainly have to add a new change point to my approval model.

One reader wrote to suggest I was overstating the case yesterday when I wrote
On the Democratic side, this is yet another notice served that they can't count on winning in 2006 simply on the basis of poor approval ratings of President Bush. He may not be that dramatically unpopular by election day.
After all, a few polls in May and June don't forecast November approval very well. I take the point, but I should not be read as forecasting future gains in approval. I don't do forecasting of that sort with this model, rather I model the current trend and let the future take care of itself. What my comment was directed to is Democratic glee over every "new low" over the past few months and a taste for what one blogger colorfully termed "20's flesh" when one poll touched 29% approval. The president's approval may yet fall again, even into the 20s. But the current rally shows that it could also rebound, perhaps into the 40s as it did in December and January. I simply state the obvious: if the President is not as unpopular in November as he has been this spring, what campaign themes do Democrats want to rally around then?

(And for Republicans, if he isn't so unpopular then, will you invite the President to public rallies and not just to private fundraisers?)


Click here to go to Table of Contents

Tuesday, June 06, 2006

Bush approval decline ends, upturn begins (?)


Two new polls from Quinnipiac University and Gallup have made a clear case that President Bush's approval ratings have at least halted their decline and may have started to rise. The blue line in the figure above is my standard model which takes a conservative approach to changes in approval, requiring relatively strong evidence of changes in trends. The red line is less conservative, more responsive to short term change, but also more vulnerable to mistaking random variation for true change. It is clear from the blue line that we have at least entered a period in which the President's approval has halted it's four month long decline and has stabilized, at an estimate of 34.1%. If one is a bit more adventurous, then the red line is willing to go further and say that approval has in fact started to increase, to an estimated 36.3%. Either of these is welcome news for the White House and a potential threat to Democrats who have written off the President's chances of improving his standing with the public (see caveats below for both parties!)

The Quinnipiac poll was taken 5/23-30/06 and found approval at 35%, disapproval at 58%. Gallup was taken 6/1-4/06 and found approval at 36%, disapproval at 57%.

As is clear from the figure, the red line tracks the more conservative (statistically!) blue line quite well, and has not moved very far from the blue line except during the approval rally of November-January. That it has now moved away from the conservative trend therefore is pretty good evidence that a real shift is taking place. Robert Chung shows a clear upturn in his model here. Robert emailed last week to say the Quinnipiac data alone was enough to produce an uptick. (I was tied up with another project or would have posted something then as well.) With the addition of the Gallup data, I think the case is even stronger that the uptick is real. (But of course only if you want to be less conservative than my standard model.)

For the White House the great news is we've seen six polls in row that are above the previous trend of lows: CBS/NYT 5/16-17 at 35%, CNN 5/16-17 at 36%, Fox 5/16-18 at 35%, Hotline 5/18-21 at 37% and now Quinnipiac 5/23-30 at 35% and Gallup 6/1-4 at 36%. The six polls prior to 5/17 had approval at 32, 33, 35, 33, 29 and 31. The average of the last six polls is 35.7 vs 32.2 for the previous six, a rise of 3.5%, which is pretty impressive.

So where is the increase coming from? So far, mostly from Republicans. Gallup reports today (free access here for the rest of the day) that approval among Republicans increased from 68% and 70% in early May polls to 78% in the new June poll. This reversed a slide and restored Republican support to about where in was in March and April. Independents showed a 3 percentage point uptick between early May and June, while Dems remained stuck at 8% approval. The Quinnipiac results are similar, with 74% Rep approval, 28% Ind and 8% Dem.

And that is where the caveat should come in. The improvement is driven more by winning back wavering Republicans than it is bringing Independents back. For mobilizing the "base" this is undoubtedly a good thing. But it also means that Independents are not coming back, at least not yet (they did significantly increase support in the November-January rally, so it can happen here too.) While there is a lot of talk about "the base" and "swing voters" are out of fashion, I think that the midterm also depends on what independents do. If they are angry or disappointed with the President, they lack a partisan reason to support Republican congressional candidates and might well help shift the congressional seat balance. If they are less unhappy, then a more evenly balanced vote split among independents gives a solid Republican base more weight in the ultimate electoral balance. So winning back the base is a crucial first step for the White House, but I think some improvement among independents is more important than news reports (at least) suggest is the focus of Republican electoral strategy. Whether those news reports are in fact a correct depiction of Republican strategy is beyond my competence. But if I had a say I'd push for a strategy that goes beyond the base.

Which leads me to the immigration and gay marriage issues. I'll have something to say about these in the next post or two, but for now I want to point out two things. First, I continue to believe that it is the so-called mainstreet Republicans who are coming back, more so than the "movement conservatives" on the immigration issue. Polling shows that, contra Rush and Lou Dobbs, the President's position on immigration is widely supported among all partisan groups, including Republicans. I believe Presidential leadership there has been good for approval ratings because it has brought back wavering mainstreet Republicans rather than alienated movement conservatives.

Gay marriage is presented as a "rally the base" issue, meaning in this case the movement conservatives. But I think Democrats in particular fail to appreciate that anti-gay marriage amendments have been winning substantial majorities (18 out of 20 with over 60% support) not solely on the basis of votes from the "far right religious conservatives." Dems may WISH the public had different values, but they are very mistaken if they think these votes were entirely the result of religious conservative turnout. So while I doubt the constitutional amendment itself is a net winner for the President, opposition to gay marriage is about more than just rallying the base, regardless of what we read in the papers.

On the Democratic side, this is yet another notice served that they can't count on winning in 2006 simply on the basis of poor approval ratings of President Bush. He may not be that dramatically unpopular by election day. Then what?

-------------------------------------------

I hope to elaborate on the immigration and gay marriage points in the next day or so. Apologies to regular readers for the lack of posting. The last two weeks have been taken over by another project (now finished!) but I plan to be back to more regular postings now.


Click here to go to Table of Contents