Tuesday, February 28, 2006

Bush Approval and the CBS Poll


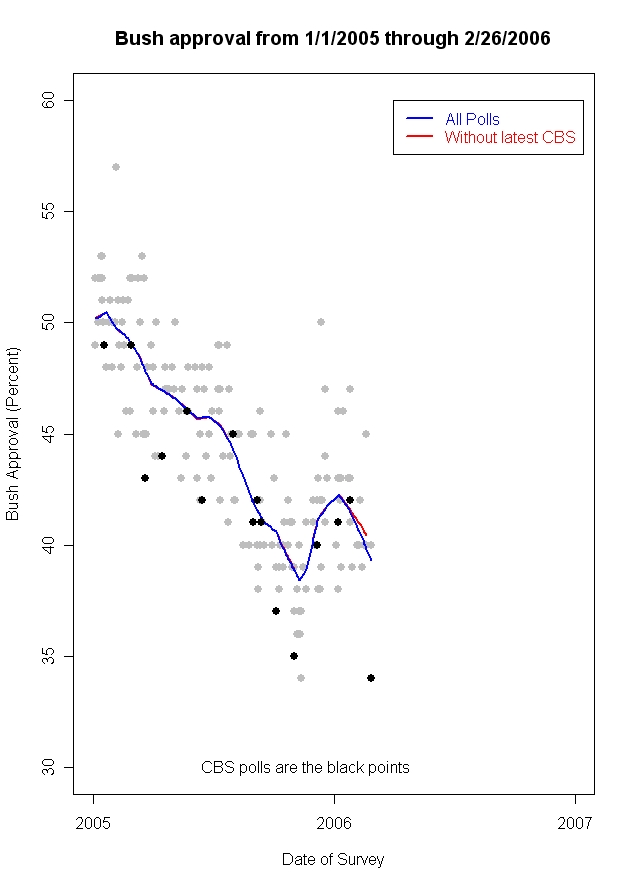
Approval of President Bush through polling of 2/26/2006. The blue trend line is estimated approval using all polls. The red trend line omits the latest CBS News poll, taken 2/22-26/06.

President Bush has suffered a decline in approval after almost two months of stable approval ratings. The decline is from about 42% to about 40% approval over the past month. In the six polls completed the last two weeks of February, the Presidents ratings have seen a low of 34%, a high of 45% and four polls at 40%. Most of these polls were completed before the question of a Dubai company operating US ports erupted last week.

Among the recent polls, the CBS News poll is the lowest and is likely to be given special scrutiny. The effect of this poll on my trend estimates is about 1%-- including this latest poll would lower my trend estimate to 39% support, while excluding it makes the estimate 40%, a modest effect.
However, the CBS poll and the Cook/RT Strategies polls are also the two taken since the Dubai port issue came on the scene. Cook's approval rating for polling taken 2/23-26/06 is 40%, down sharply from Cook's 47% in late January (1/22-25). The CBS rating is down from 42% taken at almost the same time (1/20-25) as the Cook data. So while there is a gap between the two polls on the current level, both argue for a drop of 7-8% in approval since the State of the Union Address.

As readers of PoliticalArithmetic know, "house effects" across different polling organizations result in differences that tend to be persistent over time. In the graph above, the CBS News and New York Times polls (sometimes taken together and sometimes not) fall on average a bit below the trend line. While a number of CBS/NYT polls are right on the overall trend, others tend to fall below the trend by as much as 4%, given an overall house effect for CBS/NYT of about -2% compared to the trend. The current CBS poll is further below the trend that this average, but not exceptionally far from trend based on the polling since January 2005, as shown in the figure.

It is possible to do a more serious test for "outliers" to see if the new CBS polls is farther from the trend line than we could reasonably expect by chance. The results of this analysis are shown in the figure below.


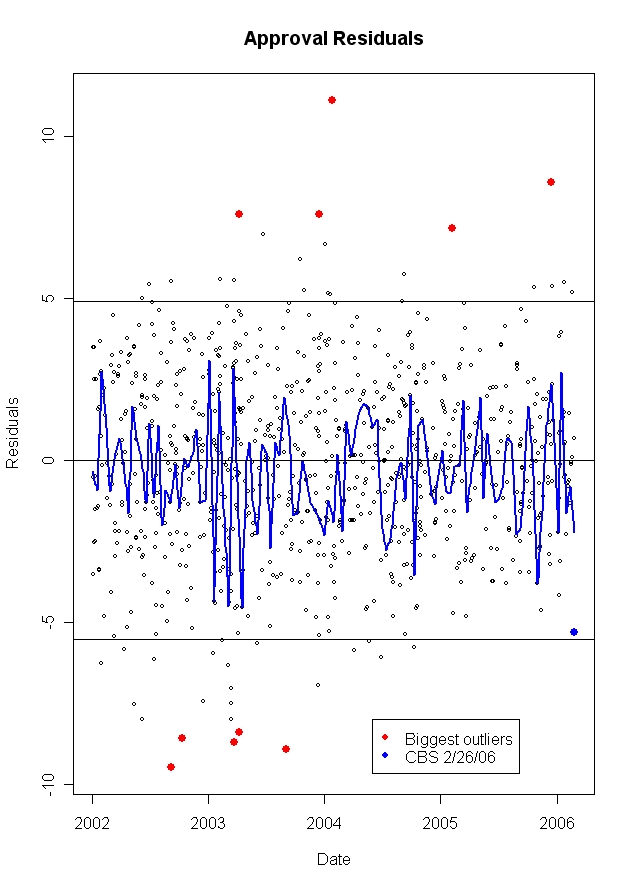
The results show that while the latest CBS News poll is well below the trend, it is by no means a statistical outlier. It is inside the 95% confidence interval, though only slightly. Moreover, as the graph makes obvious, there have been a large number of polls further away from the trend than this one. My conclusion is that the low approval rating of 34% is not exceptionally low, and given the average CBS "house effect" does not seem out of line with past polls.

There is one other important issue for the CBS poll that will undoubtedly be much discussed: the balance of partisanship in the poll. Specifically the latest CBS poll finds Republicans to be only 28.4% of the sample and Democrats 37.4%. Compared to 2004 exit polls, which showed and even 37%-37% Republican-Democratic balance, the CBS polls appear to over-represent Democrats. In part this is a difference in samples-- the Exit polls are by definition samples of actual voters (which over-represents Republicans and under-represents Democrats) compared to the CBS sample of adults. And, of course, the "True" proportion of Republicans and Democrats is a continuously moving target that is moderately affected by question wording and varies over time. However, the CBS poll may somewhat over-represent Democrats, which would partially explain the house effect that we have seen.

What is not a major effect, however, is the shift in partisan composition between the January and February CBS polls. In January (1/20-25) the CBS poll found Approval at 42%, in line with other polling, and a partisan makeup of 29.3% Republican, 37.1% Independent, and 33.6% Democrat. In January approval was 34% with a partisan split of 28.4% Republican, 34.2% Independent and 37.4% Democratic. While the Republican figures didn't change much between the two polls, the Democrats gained a bit relative to Independents. But what impact does this have on the approval ratings? The CBS Poll breaks down approval by party identification so we can see what approval in February would be IF the partisan balance had remained exactly what it was in January. The answer: with February party id we get 33.73% approval. With the January distribution of party id approval would have been 34.88%. With rounding up in both cases, the difference in party id distribution makes only a 1% difference in approval. In short, while one might wonder about the CBS data's partisan split, they are NOT driving the 8% drop in the poll between January and February.

So what is? A drop in support across all party groups, but especially among Republicans. In January, approval among Republicans was 83%. In February it dropped to 72%, a shocking 11% decline among the president's base. Among Independents support fell from 34% to 29% and among Democrats from 14% to 9%, in both cases less than half the percentage point decline as among Republicans. This also compares to support among Republicans which had remained above 90% into early 2005.

It may be that this shock to Republican suppport is a short term effect, due perhaps to the security concerns raised by the Dubai port acquisition. Or to other recent problems of the White House including the House Republican's report on Katrina. But what is clear is that the decline registered in the CBS News poll is not simply a fluke or a large bias against the president. While the CBS poll is generally a couple of percentage points less favorable than the overall trend, the drop of 8% here, and the 7% decline in the Cook poll (not the absolute level of support, 34% in CBS, 40% in Cook) should send alarms ringing in the White House and in Republican Congressional circles. After a fairly good November and December, the Bush presidency appears once more to be slipping into the kind of poll numbers that suck all political capital out of negotiations with Congress, and that set the stage for especially difficult congressional and gubernatorial races in the fall.

Wednesday, February 22, 2006

WSJ Numbers Guy on Palestinian Exit Polls

Carl Bialik, the Wall Street Journal's Numbers Guy, has a nice piece on the Palestinian exit polls today. The most important new element of his article are quotes from Palestinian pollsters Dr. Khalil Shikaki of the Palestinian Center for Policy and Survey Research and Dr. Nader Said of Birzeit University's Development Studies Program. These address the issue of selective non-response by Hamas supporters and the effects on the exit poll data. (Bialik notes in passing PoliticalArithmetik's coverage of these exit polls as well.)

Bialik also makes a good point that rules out random sampling error as the culprit:
If the problem were merely sampling error, you would expect about the same number of seats to erroneously be assigned to Fatah as to Hamas. Yet all of the error seemed to go Hamas's way. Both pollsters showed Fatah beating Hamas by seven percentage points overall, yet Hamas edged Fatah by three percentage points in total votes. And since both survey groups polled more than 10,000 voters across all 16 districts, their margin of error for the overall vote was closer to 2%.

One of the issues the piece races is what to do in the face of potential non-response bias. Bialik quotes Dr. Said as follows:

Still, Dr. Said blames himself for committing a fundamental error in data analysis: He changed his methodology in the face of surprising results. Logic dictated that, with or without Hamas interference, many mainstream voters who backed Hamas as a protest vote wouldn't reveal their choice to a stranger conducting an exit poll, Dr. Said says. And a greater refusal rate than usual -- his was 10%, above his norm of 8% -- would be expected in such a controversial contest. So he initially planned to assign more of the refusals to the Hamas ledger.

But Dr. Said let himself be influenced by the conventional wisdom surrounding the election. "Everyone here, as well as the CIA, Mossad -- everyone thought the best Hamas could do was a tie," he says. So he threw out his plan to assign the nonrespondents to Hamas.

"We should have added to Hamas in the final analysis, but we didn't because we thought the data made sense," Dr. Said says. "This is the first lesson you teach your students: You should not agree with any hypothesis, even that God exists -- it's a hypothesis you have to check."
But here is the rub: How do you know the non-responses are overwhelmingly for Hamas? (Or for George Bush in 2004?) There may be good reason to think this is so, but what data support the inference? In the U.S. we have the advantage of sample precinct returns which provide a check on the exit polls. As data come in from sample precincts they are compared with exit results from the same precinct, which allows estimation of how much non-response might be affecting the exit results. Such an option doesn't exist in the Palestinian case, where the counting process is much slower. So a Palestinian exit pollster is faced with a dilemma: adjust the results based on substantive expectations (really, your best subjective judgement about non-respondents) and admit that your statistical results are shifted by a clearly non-data driven component (which could be wrong). OR, decline to introduce non-data driven elements into the calculations, with the clear risk that your results may be biased by selective non-response. That is a really tough decision. (A third option would be to compare current results with historical election returns, but in the Palestinian case there is very little past election data to use. That will, of course, improve over time if democratic elections continue to be the practice. Such a comparison can't account for across the board shifts, but might provide some leverage on non-response that is otherwise unavailable.)

I hope I'll get to post soon on some more details of the Palestinian election. In the mean time, both the PCPSR and DSP web sites have good post-election diagnostics of their polling which are worth a look.

The NumbersGuy quotes me:
I have a lot of admiration for what they were doing.
That is absolutely true. I'm a strong "small-d" democrat. I don't know what Hamas will end up doing in office. And I don't expect miracles. But I do think that over the long haul (say 20-40 years) democratic institutions exert real pressure on political movements that enter the electoral arena. The IRA is a good example. It has taken a long time, but there has been real progress there. I hope the same for the Palestinians, though I think I am realistic about the long time frame required. What I so admire about the PCPSR, DSP and other Palestinian pollsters is that they are providing the independent data and analysis of what the Palestinian public thinks that is a necessary part of democratic institution building. Given the hard conditions in which they work, I'm very impressed with their excellence. I hope that they continue to provide the best data possible so that whoever runs the Palestinian Authority will have to consider what their public thinks.

Sunday, February 19, 2006

Do not adjust your sets...

(That's a very 1950's phrase from TV land if you are too young to recognize it!)

I'll be in London for the next week. If the Hilton has good internet access, I may have a burst of posting, as I did on the last international trip. On the other hand, the last time I was there the price for 24 hours was ridiculous. My favorite coffee shop, just down the block, has T-Mobile access (and no, it isn't Starbucks), so there is a chance you'll hear from me there. But if not, the trouble is not with your sets. Be patient and I'll be back online after February 27th for sure.

This should be the last major travel for a while, so I expect to be back to a regular posting schedule by the end of the month. Thank you for your tolerance and continued interest in the site.

Charles

P.S. And just to prove I can still post, the next item is an interesting update on the Israeli election polls. Is Kadima beginning to slide a little?

Israel Election Polls Update (2/15/06)


The current Israeli election polls can be found here. This post is out of date. Click this link for the latest polling.


Support for Israeli parties, expressed as number of mandates (seats). Smaller parties are polling at less than 10 seats each (though watch for the National Union/NRP coalition which is close to 10 seats. I'll change this graph to include them soon. The collapse of Shinui is still interesting, so I haven't replaced it here yet.)

Since the Palestinian Legislative Council elections on January 25, there has been a small but detectible loss of support for Acting Prime Minister Olmert's Kadima party. This has not been mirrored by a similar rise by either the Labor Party or by Likud. Smaller parties have also not shifted appreciably, though the new National Union/NRP coalition is polling near 10 seats in recent polls. In the current Knesset, National Union and it's partner Yisrael Beiteinu together have 7 seats while the NRP has 6 seats. Yisrael Beiteinu by itself is now polling between 6 and 8 seats, suggesting that National Union+NRP have captured some 3-4 seats beyond their current strength. (I'll come back to do a post on the small parties soon. There isn't a lot of movement but together the small parties may well command important leverage.)

Related posts: For earlier posts on the Israeli elections, see here.

For posts on the Palestinian elections see here, here, here, here, here and here.