(Click graph twice for best resolution, depending on your screen settings.)
A small footnote to history. President Truman holds the dubious record for the lowest approval rating ever registered in the Gallup poll. But exactly what was that record low? During the low point of President Bush's approval decline this spring, this began to look like a question of some contemporary relevance. And that is when it became clear that this record was not as certain as it appeared.
There was wide agreement that Truman held the record, but was it 23%, as Gallup routinely reported? Gallup's columns, based on the information in Gallup Poll: Public Opinion 1935-1971, explained that Truman's low of 23% occurred in consecutive polls, Nov. 11-16, 1951, and Jan. 6-11, 1952. The latter also registered the all time high of disapproval, 67%, a neat symmetry.
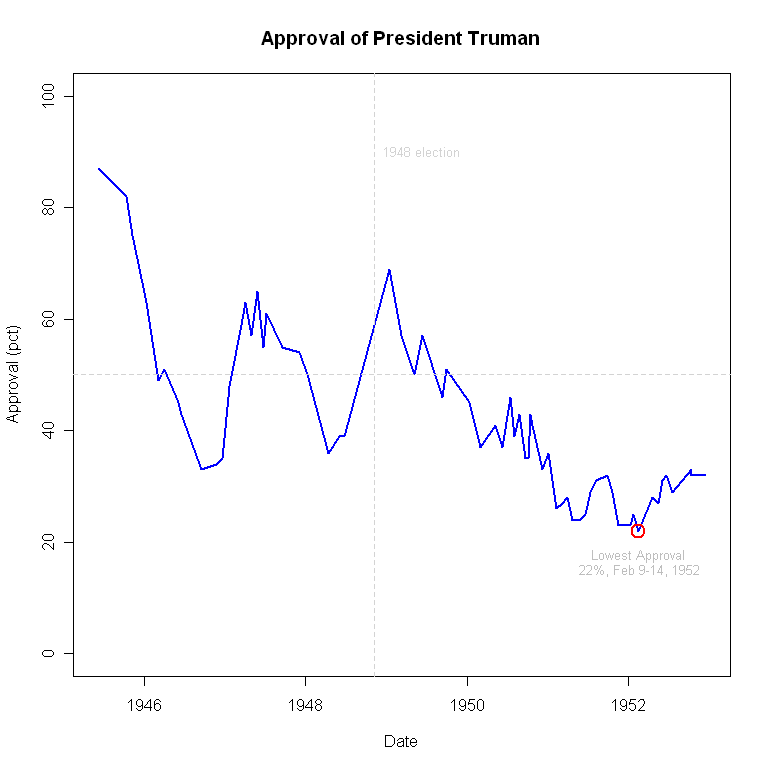
When I wrote a piece in early March on how low approval can go, I ran into a discrepancy in the data. I developed my approval database using data from the public (and free) data at the Roper Center at the University of Connecticut. When I analyzed those data, I found Truman's low to be 22%, not 23%. That low was found for a survey conducted 2/9-14/1952, a month after Gallup's reported low. I added a note to my original post pointing out the uncertainty about the record low, and did a little research.
First, I checked the original data. The Roper Center is an invaluable archive of historical polling data, available to researchers through University memberships with Roper. Thanks to the University of Wisconsin's membership, I was able to download the original Gallup survey from 2/9-14/52 and reanalyze the raw data. That showed that indeed, the approval rating was 22%, or 22.23% if you really want to be picky. Disapproval was 64.56% with 13.21% undecided.
But if the data were clear (and Roper had in fact listed 22% on it's website as well) why did Gallup still report 23%? I consulted the printed source of Gallup data from that period, Gallup Poll: Public Opinion 1935-1971, which turned out be be the source Gallup used as well. It clearly reported that the February 9-14, 1952 poll showed 25% approval, making the earlier November and January data the record, at 23%.
At that point I thought I had reached an impasse, so I contacted Frank Newport, the Editor in Chief of the Gallup Poll and laid out my evidence. He and colleagues at Gallup investigated and reported back that they concurred with my evidence, the dataset from Feb. 9-14, 1952 appeared to be the best evidence, and their analysis of that poll agreed with my results. It appears the printed volume is in error, and was the source of their use of the 23% low figure. Newport explained the process they went through on his Editor's Blog at the Gallup site here. (This is a free section of their otherwise subscription only site.)
What remains a bit of a mystery is why the published volume got the data wrong in the first place. Newport notes some possibilities in his posting. One he doesn't mention but which appeals to me is that the poll between the 23% on 1/6-11 and the 22% on 2/9-14, is in fact a 25% approval rating. It would seem an easy mistake when compiling the Gallup printed volume to have misread the data for the 2/9-14 poll. We can't know, but if this was read from a list of polls and their approval ratings, a slip of only one line would produce the 25% in the printed volume.
So let the record show that the all time low for presidential approval was 22% on Feb. 9-14, 1952.
My thanks to Frank Newport and colleagues for their help and their willingness to go to some trouble to confirm my suspicions. The openness and collegiality of the Gallup folks is a model for the opinion research profession, one that in my experience is widely if not universally shared.
Click here to go to Table of Contents