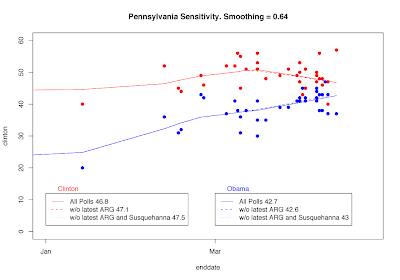
Time for a look at the sensitivity of our trend estimators. ARG has a new Pennsylvania poll out showing a 20 point Clinton lead. But Susquehanna Polling has one completed three days earlier with a 3 point Clinton lead and Zogby has one on the same day with a 4 point Clinton lead. Did things shift that swiftly or do we have an outlier?
Our standard trend estimator is designed to resist outliers, and it manages to do so in this case (see the chart above.) With or without ARG (and with or without ARG AND the close Susquehanna poll) the trend estimates only change by 10ths of a percentage point. What does change slightly is the slope of the trend estimate between the solid line with all polls and the dashed and dotted lines without ARG and without ARG and Susquehanna. In fact, the changes are slight enough you need to squint to really see them.
It may surprise you that removing ARG makes Clinton's trend estimate go UP, when you would understandably expect it to go down. The reason is simply that she is trending down either with or without ARG. Removing ARG means that the latest poll for the trend estimate is 3 days earlier, hence higher up on the downward trend. Since ARG doesn't much affect the slope, removing it just "backs the trend up" by three days, making Clinton a tiny bit better off. The same happens in reverse for Obama-- without ARG he is a shade worse off (0.1 percentage points) because his trend is rising either way, so backing up 3 days hurts him a tiny bit. (Removing ARG and the close Susquehanna poll makes similarly modest changes to the trend estimate.)
So for our standard estimator, whether we include or exclude the latest ARG poll makes very little difference.
That is by design. At this point a single new poll that shows a big change should be regarded with caution. It MAY reflect a big shift over the weekend. But it could just as easily be a statistical fluke that will not be replicated in other new polls. Until there is more evidence one way or the other, the trend estimate is designed to not chase after a single poll far away from the other data. But if we get two or three more polls showing similar results, the trend estimator will then be convinced the shift is real, and will turn in the direction of the new data.
But what if we decided to be less cautious and more willing to respond to new polling? For that, we have an alternative estimator that is about twice as sensitive. This one will pick up new trends much more quickly, but will also be misled by a single outlier much more easily. Let's see what this more sensitive estimator thinks is going on.

With the sensitive estimator, the ARG poll makes a HUGE difference. It shifts the difference in trends from a 4.3 point Clinton lead to a 12.6 point lead! That is really responsive. But it also demonstrates what a large difference a single poll can make when we crank up the sensitivity of the trend estimator.
What is more interesting with the sensitive estimator is that taking out ARG, we see a flattening of Obama's trend and even a tiny downturn, though also a continued decline for Clinton. If we also take out Susquehanna we find Obama continuing to rise but Clinton falling at a slower pace than without ARG alone. (You really have to squint to see the dotted line. Sorry about that.) Clinton leads by 4.2 without ARG AND without Susquehanna, by 4.3 without ARG alone.
So perhaps the sensitive estimator is showing us something new-- Obama may have flattened or even turned down a shade recently, but if so Clinton seems to have continued to decline as well. This also illustrates why we prefer our more conservative estimator. The sensitive version is just too dependent on individual polls at the end of the series. It provides a possible early hint of things to come, but is too unstable to count on. Our standard estimator may be a little slow to pick up a change of direction, but it seldom chases after random noise.
As for ARG's result, let's wait a day or two and see what other polls have to tell us and how our estimator responds.
For an animation of the Pennsylvania sensitivity analysis for a wide range of sensitivity, download this Acrobat file and use the arrow keys to control the animation speed.