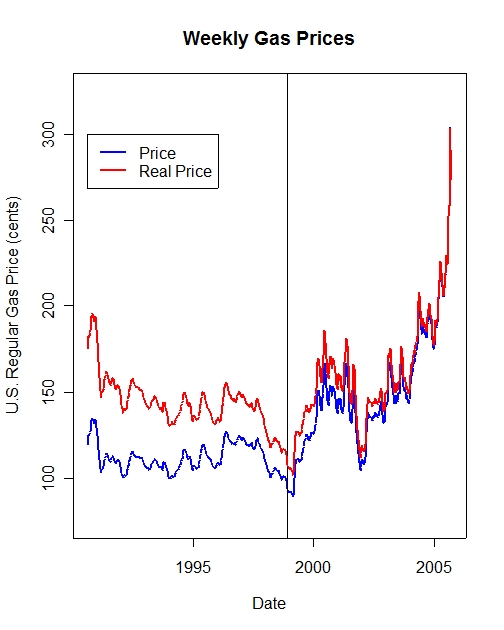
U.S. gasoline prices, 1990-2005.

We've all paid at the pump, but what does the actual data look like? Here are the nominal and real price series for regular gas, since 1990. The data are weekly averages for the U.S. from the U.S. Department of Energy. The real prices are calculated based on the CPI (EXCLUDING energy, and seasonally adjusted) with $1.0=August 2005.
Oh, and that vertical line in the graph, that's when I bought my SUV. Good timing, huh?
(P.S.-- This is a revised graph. Wrong real price variable earlier. Ugh. It was too late to post, I guess.--chf 9/28)
What about regional variation in pricing? Here it is, in nominal prices.

Regional Gas Prices (Nominal prices), 1990-2005
As you can see, there is a bit of regional variation, but the correlation across regions is quite high.
Data: DOE Gas Prices are here.
The CPI is from FRED (at the St. Louis Federal Reserve), here.