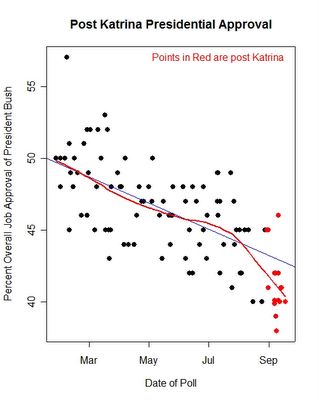
Overall Presidential job approval, as of 9/18

The lastest national polls have continued to report the lowest approval ratings of President Bush's administration. The graph adds three new polls, from CBS/NYT (9/9-13/05, App: 41, Disapp: 53), Fox/Opinion Dynamics (9/13-14/05, App: 41, Disap: 51), and Gallup (9/16-18/05, App: 40, Disapp: 58). The AP/Ipsos poll (9/16-18) appeared after I mdae the figure, but doesn't change the results: App: 40, Disapp: 57.
With these new polls added, my model of approval estimates a Katrina impact of -1.48, which is now solidly statistically significant. Alternative models produce estimates from -1.35 to -2.10.
I've also added a lowess (local regression) trend line (in red) to the plot, as suggested by Robert Chung (thanks!). You can easily see the shift in the local fit since Katrina hit. Robert has an excellent discussion of polling house effects here.
The interesting question will now become whether this Katrina impact will be short lived or if it will represent a permanent shift in the President's approval rating. More on that shortly.