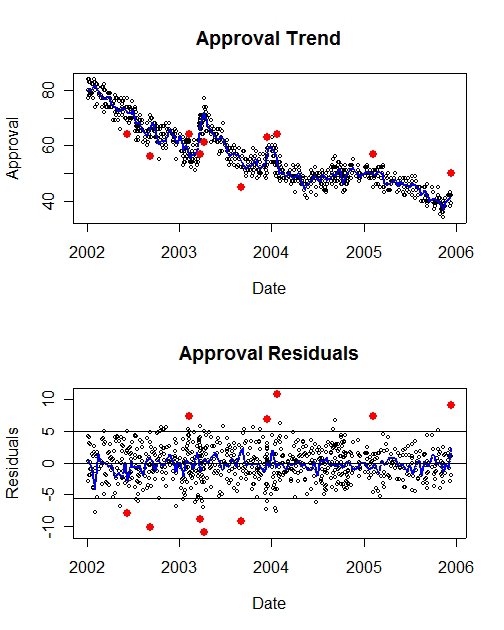
Approval trends and residuals, January 2002-December 14, 2005. The solid red points are the most extreme 1% of all residuals. The middle band marked by horizontal lines includes 95% of all polls.
Yesterday the new Diageo/Hotline/Financial Dynamics poll was released showing approval of President Bush at 50%. I posted here about that result yesterday. An email conversation with MysteryPollster Mark Blumenthal has provoked me to follow up on this. Blumenthal suggested looking at other polls that are unusual and using that to put the Diageo/Hotline result in perspective. Excellent idea! And since Typepad is down, Blumenthal will have trouble posting his own thoughts about this to MysteryPollster.com. Credit to Mark for the idea. Blame to me if the execution falls short.
All polls are subject to sampling errors, so two polls taken under identical conditions will vary by a highly predictable amount. That variation depends on the sample size (and sample design) and the variability in the population. Polls also vary due to non-sampling errors. These come from question wording, order of questions in the survey, "house" effects due to different procedures across polling organizations, response errors and "everything else" that can lead to error in a poll. The combination of sampling and non-sampling error is often referred to as "total survey error". The problem is that we have well established formulas for calculating sampling error, but the modeling of non-sampling errors is much harder and lacks the formal properties that sampling errors possess. Sampling error reflects the variation in polls we'd find if there were no non-sampling errors. Total survey error reflects the actual variability we see. My approach here reflects the total survey error approach.
There are 858 national polls measuring approval of President Bush since January 1, 2002 in my database. (I'm omitting 2001 here because the shock of 9/11 creates unique polling problems that are not present in the 2002-2005 data I use.) The median sample size of those polls is 1004 (I have missing data in the sample size variable, so take this as a reasonable estimate but not necessarily exact.) If sampling error alone were the source of polling variability, then the margin of error we would expect for samples of 1004 cases would be +/- 3.1%. So that gives us a baseline for errors due to sampling alone.
To estimate the total survey variability, I fit a local regression to the series of 858 polls. That is plotted in the top half of the figure above. In this case I deliberately use a fit that allows lots of local variation. In other posts, I normally "smooth" this trend more to emphasize systematic trends over time, rather than short term "bumps" that are probably not meaningful. Here however, I want to give the polls the maximum benefit of the doubt. This means that the trend line will respond to what is in fact just noise, but will treat that noise as if it were a politically meaningful signal. This is a conservative procedure because it will tend to UNDERESTIMATE the size of the polling variability.
From this fitted trend line, I calculate the "residuals", the observed poll value of approval minus that predicted by the trend line. These are plotted in the bottom half of the figure. The upper and lower horizontal lines include 95% of the polls in the dataset. In theory, these would be symmetric about zero, but in these actual data there are a few more low values than high ones, so the lower bound is -5.55% while the upper is +5.07%.
Compare this result with what sampling error alone would produce, a range of +/- 3.1%, or a range of 6.2%. The actual range for 95% of the cases is 10.62, or 75% more variation than would be predicted by sampling alone. This is quite typical of comparisons of total survey error with sampling error alone in the sort of pubic opinion data we are working with here. (A footnote here: I'm using the average sample size to compute the sampling error. Technically I should compute that for each of the ACTUAL sample sizes and then combine that to get the implied sampling error. That number would be bigger than the +/- 3.1% I'm using here, so my approach is a little unfair because it underestimates the true sampling error. That makes the proportion of non-sample error a bit larger than it actually is. I doubt the technical correction would matter a lot, and it doesn't matter for my main point, so I'm using the simpler approach.)
So any poll is subject to this kind of variation, and the total survey error is a good estimate of the amount of variation we should expect in practice. It gives us a benchmark to use in assessing the deviations from the trend that we see in any particular poll.
We can now turn to the Diageo/Hotline poll. The residual for that poll is +9.12% above the trend line estimated based on all the polls. That is considerably beyond the upper bound for a 95% confidence interval. In fact, it is among the most extreme 1% of all the polls taken since January 2002. The 10 most extreme residuals in that time are
Zogby -10.96 4/9/2003
IBD/CSM/TIPP -10.17 9/8/2002
Zogby -9.13 9/5/2003
Zogby -8.88 3/24/2003
IBD/CSM/TIPP -7.94 6/9/2002
Gallup/CNN/USAT 6.95 12/16/2003
Gallup/CNN/USAT 7.31 2/6/2005
ABC/WP 7.44 2/9/2003
Hotline/FinancialDynamics 9.12 12/13/2005
Annenberg 10.89 1/25/2004
This represents about 1.1% of all polls in my database. So by that standard, the current Diageo/Hotline poll is exceptionally far from the trend line.
But every dataset has to have a most-extreme 1% of cases, so what can we make of this result? One conclusion is that we should thank the Diageo/Hotline people for reporting their results despite the large difference from other polls. It is not unheard of for pollsters to bury their results that look too different, or to "fiddle" with the weighting or other things to bring the results a bit closer to other polling. Everyone wants to make news but no one wants to look too extreme. It is, ironically, a sign of the credibility of the Diageo/Hotline people that they were willing to put this result out when it was certain to be remarked upon as out of line with other polling (exactly as I am doing here!).
But the fact remains that this poll is far beyond the bounds we would normally expect, even when taking total survey error into account, and not just sampling error. By this standard, we can say that we would very much doubt that the Diageo/Hotline result is simply a random outcome from the same process that has generated all the other polling. But the source of that exceptional variation remains a mystery. Our conclusion should be that this result should be substantially discounted in estimating approval of President Bush.
Every polling organization can produce results that are outliers. What is important is spotting them and putting them in proper perspective. That is far more desirable than suppressing the results or pointing to them as examples of "bias". What matters is performance over the long term, not in any single sample.