Approval at the low ebb of post-war presidencies by partisan groups. (Kennedy and Johnson are omitted due to missing data.) President Bush is helped substantially by the still solid support from Republicans. This partially compensates for his below par performance among independents and Democrats. The Bush data points are for his current standing (March 1) of 38%, not his all time low of 37% on November 13, 2005. (Can you guess who the unlabeled points are? Test your knowledge. Answers are at the bottom of this post.) Hint: Click on the figure and then again for optimal resolution.
Reader Stephanie M. wrote in with an excellent question today: How low can presidential approval fall? Is there some natural lower limit below which it cannot go. At the same time, some Democratic partisans are posing the same question, though with more glee than scientific curiosity.
The short answer, of course, must be that no one knows how far President Bush's approval rating can and will fall. My view is that this is primarily a function of events, the economy, and presidential leadership success or failure. Some presidents have fallen quite low and then rebounded while others have become mired in their slumps and make only modest recoveries. Lacking a crystal ball, I have no idea what successes or failures may be forthcoming from the White House, so I'm not trying to make a prediction of the bottom of approval for the Bush presidency. Rather I'm trying to answer Stephanie's question and put the President's approval ratings in some more perspective.
First, I'm using only Gallup data in order to have comparability over time, so no CBS 34% here. At his current 38% Gallup approval, President Bush can take some (small) comfort in the fact that every president since Kennedy has fallen below 38% at some time in their presidency. Here are the low points and their dates:
Truman, 22%, 14 Feb 1952 All time low.**
Eisenhower, 48%, 1 Apr 1958
Kennedy, 56%, 17 Sep 1963
Johnson, 35%, 12 Aug 1968
Nixon, 23%., 7 Jan 1974
Ford, 37%, 13 Jan 1975 and 31 Mar 1975
Carter, 28%, 2 Jul 1979
Reagan, 35%, 31 Jan 1983
Bush (GHW), 29%, 2 Aug 1992
Clinton, 37%, 6 Jun 1993
Bush (GW), 37, 13 Nov 2005
** Gallup cites 23% as the record low for Truman. The Roper Center polling archive contains the February 1952 poll cited above which seems to show a 22% rating. I doubt Gallup has this wrong, so there may well be a problem with the Roper Center data. I'm trying to get this clarified. So accept either 22 or 23 as the record.
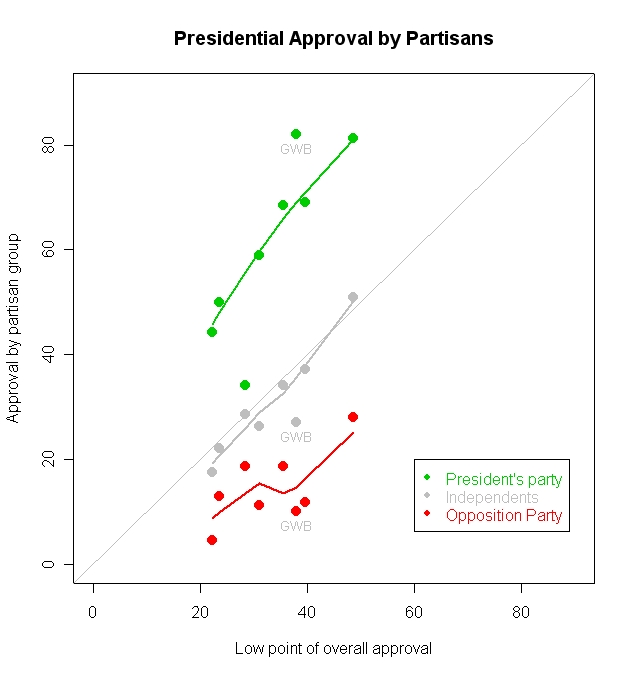
We can look at the structure of support that presidents draw from partisan supporters and opponents when they hit the low point of their presidencies. The figure above plots the approval rate in each partisan group against the overall low points in approval for each president. The trend lines show what "par" for each group has been.
One thing that is clear is that opposition partisans play a relatively minor role in setting the low-point of approval. Between 23% and 40% overall approval, support among the opposition doesn't really vary systematically with overall approval. A president at low ebb can expect between 10% and 20% support from opposition partisans, and that doesn't seem to decline very sharply at all as overall approval falls from 40% to 20%. In the very lowest case, Truman, support from Republicans fell noticeably below that for other presidents, to an astonishing 4.5%. No one else before G.W. Bush has fallen as low as 10%. At the low point of Bush approval on November 13, Democratic support fell to an almost Turmanesque 7%. The most recent Gallup poll, completed March 1, finds Democratic support at 10%, still the lowest of any president since Truman, though not far from Clinton (11.8%) and the elder Bush (11.3%). Nonetheless, once approval is this low among opposition partisans, they simply can't drive it much lower because there is almost no one left to change their mind.
Independents provide more room for dynamics. Support here falls at almost a 1-to-1 rate between 40% and 20% approval. Independents seem just slightly less approving of slumping presidents than the total population, but their movement seems to track quite well with overall approval. The difficulty for President Bush here is that he is noticeably less popular among independents than one would expect of a president with a 38% overall approval rating. Instead, his approval among independents is some 9-10% below what we might expect based on other presidents.
The great strength of President Bush remains "the base", or Republican partisans in this case. Here he far surpasses "par", with an 82% approval rating among Republicans (as opposed to the expected rate of just 69% in the figure.) Even at his low point in November, President Bush still captured 79% support among Republicans in the Gallup poll. (CBS has a much lower estimate, 72%. The Gallup data have been quite stable in the low 80% range for some while.) So long as the base remains this loyal, it can buffer to some extent the unhappy independents. Given where independents and Democrats are at this point, the President would be in much worse shape if Republicans were not so strongly supporting him. A fall to the expected 69% or so would cost the President some 3-4% points in approval and put him at 34-35% overall support, rather than the current 38%. This is why current Republican Congressional unrest over the Dubai port company sale and other events should be a source of particular concern. Conservative displeasure with Harriet Miers' Supreme Court nomination helped drive down Republican support a little during the fall. The White House can ill afford losses here.
So, there is clearly room for more decline in Bush's approval rating. Democrats can't do much more harm but independents and especially Republicans can and both groups have some room for further decline, with Republican losses the most worrisome. By the same token, if the President won back some of the independents, he could stand to gain modestly. At about 32% of the adult population, a gain of 3% support among independents offers a 1% gain in overall standing. In point of fact, this is much of where the President's boost came in November and December. Between November 13 and December 11, Bush gained 10% approval among independents, from 28 to 38% support. Since December 11, however, independents have fallen back to their current 27% support.
All this shows that there is room for slippage if Republicans jump ship, and some smaller room for decline due to further independent unhappiness. But it doesn't answer Stephanie's question of whether there is a "floor" below which approval won't fall.
We've never seen approval fall below 22%, Truman's ignominious mark set in 1952. Nixon came close at 23%, and Nixon comes closest to offering evidence of a floor. The graph below shows Nixon's approval rating throughout his term.

What is striking is that his support reached an equilibrium around 25% after January 1974, even though it fell precipitously to get there. The period from January to August 1974 did not include many happy days for the Nixon White House, and yet approval really didn't budge for seven months. Even in the "final days" before he resigned on August 9th there was only a tiny hint of movement in the polls.
One can only speculate as to what would have happened to Nixon's public support had he refused to resign. The near total loss of Republican Congressional support might well have driven popular approval down below Truman's 22%. So while I think the January to August 1974 period is some evidence that there is a floor, I don't think that floor is terribly solid.
Fellow partisans can provide some minimal level of support. In Nixon's case approval among Republican's remained at 49.9% four days before he resigned. In contrast, Jimmy Carter fell to an amazing 34.2% approval among Democrats on July 2, 1979. Ironically, his 18.7% support among Republicans and 29.6% among independents kept him from challenging Truman's record. (At his lowest point, Truman still had 44.3% support from Democrats.)
So yes, it can go lower. And while the mid-20% range has been the practical limit, we can't say with much confidence that no president could ever drop below that, though it would take the abandonment by his own party to do it.
As for President Bush, he is being held up by his Republican base. If they stay with him, only moderate further slippage seems likely. If they start to doubt, then there is a lot of room for approval to fall once the base starts to weaken.
Data: The data are from the original Gallup individual level data files, which are available from the Roper Center (for a substantial membership fee.) I built the files and calculated the partisan support by party. The current Gallup approval by party identification data is available at the Gallup Web site (for a much smaller fee.) In the cases of Nixon, GHW Bush and Clinton I've substituted data in the first figure other than their absolute low points. The Nixon and GHW Bush datasets are not available from Roper at the moment. For Nixon I used the last Gallup poll before he resigned, a poll ending August 5. For Bush I used the Gallup poll just prior to his low point on Aug. 2, 1992. In Clinton's case, the actual low point came June 6, 1993 in the aftermath of the failed Lani Guinier nomination as Assistant Attorney General for Civil Rights. However, this was a short term drop in approval that quickly recovered. The more politically consequential failures of support for Clinton came in August 1994 when his approval sank to within 1% of the 1993 low while setting the stage for the Republican victories in November. For that reason I used the 1994 Clinton data. (Update 4/26/06: The individual level data for Ford were not available at the time I did this post. I have now added his low approval rating to the table above but have not added him to the figures.)
Solution set: Here is the top figure with the points labeled for each president. How'd you do?

Click here to go to Table of Contents