Tuesday, July 31, 2007

Pres08: Is Anyone Paying Attention? You bet!


As everyone knows, the presidential contests started early this round. But how much attention are the races getting from ordinary people (i.e. not us junkies here.) The debates have had small audiences, but news coverage is quite substantial. How much attention are voters paying?

The Pew Center has asked a consistent question on attention to the campaign going back to 1988. Their question:
As I read a list of some stories covered by news organizations this past week, tell me if you happened to follow each news story very closely, fairly closely, not too closely, or not at all closely. News about candidates for the 2008 presidential election?
Looking at those saying they are following the news about the campaign "very closely" we find the pattern in the figure above. Around 20% of the sample of adults say they are paying this much attention to news about the election. On the one hand, that means many are not. On the other, no previous election for which we have polling this early comes close to that 20% figure. The three previous races with any polling as early as this found 10-15% paying "very" close attention to the campaign. Only about 10 months before election day, or about the start of the primaries and caucuses, do we typically see interest move up to high levels, varying from about 18-35% over the various election years.

So this year's level of interest looks quite high, compared to previous years about this time, but at an absolute level, it remains only a fifth of adults who are glued to campaign news.

If we add "very closely" with "fairly closely", the current interest is 53%, a substantial increase, but the pattern in the plot is unchanged-- 2007 stands above any previous year, but the final attention by the general election rises to over 90% when using this combined measure, so 53% now is certain to rise to near 100% by November 2008. So either analysis says current attention is well above the norm, but still has a lot of room for increase.

The most interesting races have, oddly enough, involved incumbents named Bush. The 1992 three way race and the 2004 contest provoked the greatest attention from the Pew samples. Curiously the closest of all contests, 2000, had the second lowest final attention measure of the five completed races in the plot.

Comparing attention today with past races, we appear about 5-6 months ahead of attention in previous cycles. The 20-25% paying high attention now is usually reached around January of the election year. One interesting question is how much, and how soon, attention will grow. Perhaps we are starting high this cycle, but will converge to the range of previous cycles by January. Or perhaps we'll remain above past races through November 2008. Wait and see.

The one constituency that is certainly paying more attention earlier is pollsters. At this point in the 2004 cycle, there had been 53 national nomination polls. As of July 22 this year, we had 109, more than double the previous pace.

In part this is because we started earlier this year:


The earliest consistent polling on the 2004 race began after November 2002. (I may have missed a handful of earlier polling, but certainly not a great many.) In contrast, regular polling on 2008 began immediately after November 2004. The density of polls in 2005 and especially 2006 was substantially above comparable levels in 2002-03.

However, once the contest ramped up, the rate of new polls has been quite similar between the two years. When the blue line for 2008 turns sharply up, it runs in parallel to the 2004 polling. Clearly 2008 will ultimately far outstrip 2004, but for now we are seeing comparable rates of polling, just shifted back in time.

The shift is the equivalent of six months in the campaign schedule. If I shift the 2004 data back by exactly 6 months, the result is a near perfect match, seen below (again, after the longer run up in 2004-2006).


So for those of us obsessed with campaigns and public opinion, this is great news-- the most studied race in history in going on right now, and we have box seats.

Monday, July 30, 2007

Primaries Past


A quick reminder not to assume what is today will be so tomorrow.

The 2004 Democratic primary race as of late July 2003 showed a continuous first place held by Lieberman, though with a slow but steady erosion. Kerry and Gephardt locked in a long running tie, and Howard Dean a rising 4th place at about 12% support. Clark's late entry and sharp rise hadn't happened. Edwards looked like a goner as his initial 9% had sunk to about 5%. So from this, who would be the candidates left standing after Iowa?

But of course the dynamics changed. Between summer and late fall, Dean became the "inevitable" nominee, sparking talk of running mates and gaining Gore's December endorsement. Kerry by that point was under 10%.

And then Iowa happened, and support shifted dramatically to Kerry and Edwards and away from Dean. (And Gephardt and Lieberman were gone.)

To those who say this is clear evidence that early polling is useless, I'd say no-- early polling is reflecting the dynamics of the race. But the dynamics are highly fluid and the point of the polling is not to predict the winner from today's polls, but to understand how the race is moving and ultimately to look back at how we got to the final outcome.

The great mistake analysts make is to look at current polls and conclude from them that the dynamics are fixed. That Dean can't rise. That Dean is a lock. That Kerry was inevitable after all.
The current Democratic race appears, as of last week's polling, to be relatively static. And compared to the Republicans that is certainly true. But let's not jump to the conclusion that the polls after Labor Day have to look like today's just because today's look like June 1. The polls are of interest for what they show about the history of the race so far and how it stands today. Not for their ability to predict what happens in a month or two.

Tuesday, July 24, 2007

Bush Approval: Three new polls, Trend at 29.6%


New polls have moved noticeably above President Bush's recent low point of approval, though the current trend estimate remains below 30%. New polls have generally fallen at 30% approval and above, though one is as low as 25%. This change of trend was first discussed about a week ago here. Since then, the evidence for a shift in trend has mounted.

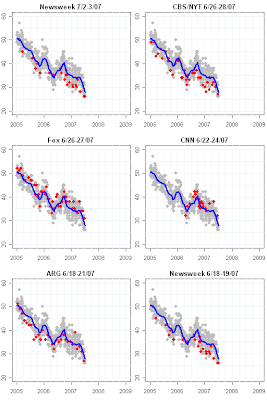
The ARG poll, taken 7/18-21/07, sets the low point at 25% approval, 71% disapproval. Gallup, done 7/12-15/07 got approval at 31%, disapproval at 63%. CBS/New York Times has two recent results: 7/9-17/07 has approval at 29%, disapproval at 64%, while the newest CBS/NYT poll of 7/20-22/07 puts approval at 30%, disapproval at 62%. Fox, 7/17-18/07 has approval at 32%, disapproval at 61%, while ABC/Washington Post 7/18-21/07 estimates approval at 33% and disapproval at 65%. So that puts four of the last six polls above 30% with only one in the mid-20s, where polling in late June was falling.

The trend estimate now stands at 29.6%, and the slope of the trend has clearly begun to bend from a steep downward trend to a less negative one. This is classic behavior of my standard "old blue" estimator. It takes a while to change direction, and while it does it slowly bends until it shifts direction entirely. In contrast, the "ready red" estimator is more sensitive and picks up on direction changes more quickly. The red line in the figure above shows a sharp change at just under 29% to a current estimate of just under 31% approval. The red line is often too sensitive, mistaking short term random noise for real change. However, we've now accumulated enough supporting polls to make me more confident that the upturn in the red estimator is probably real. At the same time, this does not mean the trend will remain as sharply up as the red estimator seems to suggest. That won't be known for a while yet, as more polls help define what the path of the next month or so is.

Recent polls have fallen above and below the trend estimate, and at the moment none of the last 10 polls constitutes an outlier, though there are both high and low polls rather close to the confidence interval limits. This range of results is also reflected in the very wide gray area at the end of the trend in the Bootstrap plot below. The wide gray area reflects our uncertainty about where approval is right now in a time of change in direction.

Finally, the last plot below shows the most recent 20 estimates of approval. The red dots trace out the clear decline, low point, and move back upwards in the "old blue" estimator. So even that estimator is feeling a change.


Thursday, July 19, 2007

Giuliani Campaign's Analysis of Recent Trends

(Ed. Note: Brent Seaborn, Director of Strategy for the Giuliani campaign, offers the following response to my recent post on the trend in support for Giuliani.)


By Brent Seaborn
Director of Strategy

Rudy Giuliani Presidential Committee


Despite assertions to the contrary on this site, the Giuliani campaign is in a very strong position at this point and is clearly best-positioned to win the primary. Let me point out a few differences between the McCain and Giuliani trend line:

  • When Mayor Giuliani first announced his candidacy for president, he received a considerable bounce in the polls. We anticipated that the race would close after our initial bounce – in memos written on March 22 and June 22. I wrote, at the time, we should expect polls to tighten, as they have.
  • As the race developed early in the spring, the race quickly but briefly, developed in to a two-way race, and our initial bounce extended into the beginning of this two-way race. The two-way race divided most of the Republican primary vote between 2 major candidates – the nature of a two-way race generally forces undecided or leaning voters to make a choice between the leading candidates and many broke our way.
  • As McCain’s trend line declined Mitt Romney’s slowly rose and Fred Thompson entered the race. Senator McCain is still a candidate for President and continues to receive a substantial vote share.
  • Fred Thompson now seems to be the beneficiary of an announcement (or pre-announcement) bounce. And Fred Thompson’s entry to the campaign has effectively made this now a four-way race.
  • After months as the frontrunner and the addition of a fourth candidate to the GOP primary it is notable that we are in roughly the same spot we were in before our bounce and when this was still a three-way race. In a four-way (or as your graph suggests a five-way race), a trend line from the first of the year until now, excluding our “announcement” bounce, is virtually flat.
  • I also note this paragraph:

“Are there any bright spots for Giuliani, other than money? Yes. There is a hint in the data that his decline may have slowed and support stabilized in the last month. In the first plot above, the blue line is my standard trend estimator which is rarely mislead by "blips" in the polls, but which is also a bit slow to be convinced that a change of trend has occurred. The red line in the plots is my more sensitive estimator-- quicker to notice a change, but also more easily fooled by "changes" that turn out to be phantoms. The red estimator has flattened out recently for Giuliani, and currently sees relative stability at about 26%. The blue estimator instead sees continued decline and a current level just under 25%. If the red estimator is right (and it often isn't) then perhaps the worst days of declining support are now behind Giuliani, at least nationally. If so, his campaign can try to get the trend moving up instead of down, but at least the decline has stopped. Unlike McCain, Giuliani has the money to try to make the numbers turn up.”

I believe this is more than a blip. The red trend line will begin to pull the blue line up to meet it. In fact, if one looks at major media polls over the last month most of them show Rudy Giuliani receiving 30% or more of the GOP primary vote. In fact the mean of the major media polls over the last month is 29%

Newsweek 6/20-6/21: RWG 27%

CNN 6/22-6/24: RWG 30%

FOX 6/26-6/27: RWG 29%

CBS 6/26-6/28: RWG 34%

USA Today/Gallup 7/6-7/8: RWG 30%

AP 7/9-7/11: RWG 21%

Gallup 7/12-7/15: RWG 33%

FOX 7/17-6/18: RWG 27%


Major media polls actually show Rudy Giuliani ahead of even the red tend line. And I would add that the red trend line, at this point in the race, disproportionately accounts for the Rasmussen Polls that by their regularity are a drag on Mayor Giuliani’s trend line.

Overall, we are very pleased with our performance in national polls. We are aware we will continue to face challenges and the race will likely continue to close. But we believe we have a real and solid base of support and we will remain competitive as this race evolves.

Bush Approval: Two New, Trend at 29.1%


Two new polls find higher approval ratings of President Bush than last week, and both polls are above trend, lending more support for the suggestion I made here last week that we may be seeing a leveling off of the recent decline in Bush approval.

Gallup's new poll, taken 7/12-15/07 found approval at 31%, disapproval at 63%. A Zogby/Reuter's poll conducted 7/12-14/07 has approval at 34%, disapproval at 66%.

With the addition of these polls, the trend estimator is now 29.1%. More importantly the evidence of a change in trend, while still not conclusive, is beginning to be visible even with the standard, stable blue line estimate. The blue trend estimate now shows just a bit of a bend in recent estimates-- what had been declining at a constant rate since April now suggests a change. The more sensitive, but easily confused, red estimator has clearly taken an upward tick. While red is often fooled, and we should not be justified in claiming clear evidence for a turnaround, the indications are now in that direction for the first time in four months.

With only the latest four polls showing this move up, we should be cautious. Usually it takes about 12 consistent polls to be confident of a change in trend. But if we are reading early tea leaves, they suggest that the President's recent precipitous decline may be stabilizing.


Tuesday, July 17, 2007

Will Giuliani be the next McCain?


Last week I looked at the collapse of the McCain campaign. Not the collapse of money and staff, but the loss of public support that is at the root of the campaign's failure. Judging by the trend we've seen in McCain's support since November that failure has been clearly coming for some time.

But what about the Republican "front runner", Rudy Giuliani? While he has consistently remained ahead in polls of Republican voters, and his campaign is in infinitely better financial shape than McCain's, Giuliani's trend in support is eerily similar to McCain's downward trajectory.

Since early March, Giuliani's support has fallen by an estimated 8 percentage points. McCain's fell by 10 points since January. And the rate of decline has been a bit steeper for Giuliani than for McCain. The saving grace for Giuliani has been that he started his decline from a higher point, around 33%, while McCain's slump started down from 25%.

Giuliani's national slide is also mirrored in the early primary states, as is the case with McCain.


If Giuliani's decline is a little less dramatic in the states than has been McCain's, his situation is still grave in comparison to the rising candidacies of Romney (in IA and NH) and Fred Thompson (nationally and in FL and SC).

Were it not for the fundraising success of the Giuliani campaign, and its cash on hand ($15M), the analysis of his situation would be far more pessimistic than recent accounts have made it sound. In part the recent intense focus on McCain may have distracted analysts from the similar trends for Giuliani, but the attention should now shift from McCain being forced to take public transportation between campaign events to the prospects of the other candidate the press has labeled the Republican "front runner".

Are there any bright spots for Giuliani, other than money? Yes. There is a hint in the data that his decline may have slowed and support stabilized in the last month. In the first plot above, the blue line is my standard trend estimator which is rarely mislead by "blips" in the polls, but which is also a bit slow to be convinced that a change of trend has occurred. The red line in the plots is my more sensitive estimator-- quicker to notice a change, but also more easily fooled by "changes" that turn out to be phantoms. The red estimator has flattened out recently for Giuliani, and currently sees relative stability at about 26%. The blue estimator instead sees continued decline and a current level just under 25%. If the red estimator is right (and it often isn't) then perhaps the worst days of declining support are now behind Giuliani, at least nationally. If so, his campaign can try to get the trend moving up instead of down, but at least the decline has stopped. Unlike McCain, Giuliani has the money to try to make the numbers turn up.

But to make his campaign surge, Giuliani has to face the rise of Fred Thompson, whose trend estimate is now up to 20.1% nationally and with a very steady upward trend since May.


Thompson is also trending up in Florida and South Carolina, while Giuliani slumps in those states. And his prospects against Romney in Iowa and New Hamphire are looking poor as well. So while the national trend may be stabilizing, the Giuliani campaign is confronted with serious challenges in at least four of the first five states.

Let's check back in on this around Labor Day and see if the trend lines above have crossed. If they have, the second Republican "front runner" will have stumbled.

Monday, July 16, 2007

Congress stinks worse than either Dems or Reps in Congress


Congress appears to be less than the sum of its parts. Current approval of the job Democrats are doing in Congress has a current trend estimate of 34.5%, while the estimated approval of Republicans in Congress is 28.8%. But overall approval of Congress has sunk to a miserable 22.6%, less than that of either party.


Disapproval of Congressional Republicans remains a good deal higher than for Democrats due to a higher "don't know" rate in evaluating the Democrats. Disapproval of Republicans is at 64.8% while disapproval of Democrats is at 51.5%. Approval of both parties has been trending clearly down since January, while disapproval has trended up over the same time for both parties.
Amid the stories noting that approval of Congress is now below that of President Bush, it would be good to recognize that such simplistic comparisons are dangerous. Voters carry a generally negative view of the institution on Capitol Hill. Divided by parties, support is a bit higher.

Still, neither party can be comfortable with their current approval ratings. Republicans should note that they continue down despite enjoying a new Democratic majority to target for criticism. And Democrats should take little comfort in the small advantage they hold in approval. Democratic approval is trending down a bit faster than is Republican approval. Neither seems to have sold the public on their legislative agendas.

(Technical Note: The amount of polling on Congressional parties is more limited than one might wish. These trend estimates are based on all available polling, pooling the data to get better estimates than from any single poll. Individual polls, such as the new Harris Poll taken 7/6-9/07, produce somewhat different results, as seen by the spread of points around the lines in the figures. Harris, for example, found Democrats in Congress at 31% positive, 64% negative, while Republicans were at 21% positive and 76% negative. They found overall approval of Congress at 24% positive and 72% negative.)

Bush Approval: Two new polls, Trend at 28.0%


Two new polls at the end of last week find approval of President Bush a bit above recent trend estimates. The Associated Press poll, taken 7/9-11/07, found approval at 33% with disapproval at 65%. A Newsweek poll taken 7/11-12/07 got approval at 29%, disapproval at 64%. Prior to these polls the trend estimate was 27.2%. With the two added, the trend estimate now stands at 28.0%.

This is the first time we've seen a pair of polls above trend in a while. Balance above and below trend has been the recent rule. For AP, this is a 1 point gain from their early June poll, while for Newsweek it is a 3 point gain over the previous week. Neither would qualify as a statistically significant change.

I'm normally quite cautious about suggesting a change of trend based on only two polls. That caution is especially important here because the AP result at 33% is right on the margin of the 95% confidence interval, as close to an outlier as you can get. Indeed, without the Newsweek poll, AP would be a bit outside the 95% confidence interval.

But tossing caution to the wind for a moment, it wouldn't be a surprise if the President's sharp decline is due for some leveling out. Approval was stable from December through April, starting down around April 24th. Since then it has been sinking at a nearly constant rate for over two months. This has brought the trend in approval solidly into the 20s for the last 10 polls, not a simple "blip" down. But to sustain approval this low requires Republican support for Bush sinking below 60% or Independents sinking to the mid-teens. Democrats are already below 10%, so can't contribute much to further decline.

Recent polls from Newsweek, CBS and Gallup have found Republican approval between 60% and 68%. Independents have ranged from 18% to 26%, and Democrats from 7% to 10%. Gallup has a nice graph of trends by party identification here, indicating more of a downward trend among Independents, and a smaller but still noticeable decline among Republicans. Democrats have been fairly flat. Gallup's support among Republican's tends to the high end of the range across polls, probably due to different question wording for partisanship. (Gallup's long standing partisanship question emphasizes current feelings: "In politics, as of today, do you consider yourself a Republican, a Democrat, or an Independent?". Some others stress the longer term "Generally speaking, do you usually think of yourself as a Republican, a Democrat, an independent or what?".)

The question is whether Republicans are yet willing to reduce their support for President Bush still further. Republican Senators have begun a series of breaks with the President over Iraq policy and could signal to the grass roots that it is time for an end to unconditional support for Bush. On the other hand, Republicans in the House have retained their unity in support of the President's Iraq policy and so far Republican presidential candidates have refused to repudiate the President. With the divisive immigration bill behind him Bush may be able to sustain a new plateau in partisan support leading to a flattening out of his approval trend.

That assumes independents, or at least 20-25% of them, will also stay on board.

The other reason to think we may have reached a new plateau is that both the AP and the Newsweek polls are normally a bit below the trend estimate. AP is normally .93 percentage points below trend, while Newsweek averages 1.15 points below trend. While either current poll could well be randomly high and their next results return to below trend, these are not polls we usually expect to run above trend.

So the current estimate at 28% approval still signals deep trouble for President Bush, and the trend may remain in the 20s. But to sink much more is going to require a significant desertion by Republicans and/or Independents, moving below their current levels of support. The most likely way for that to happen is for Republican leaders to turn against the President. Will they?


Friday, July 13, 2007

Bush Approval: Harris: 26%, Trend:27.2%, But...


A new Harris Interactive poll taken 7/6-9/07 finds approval of President Bush at 26%, with disapproval at 73%. With the addition of this poll, the trend estimate stands at 27.2% approval. The Harris polls is in line with a recent Newsweek at 26%, CBS at 27% and Gallup at 29%. As can seen from the residual plot below, it is also well within the range of expected variation for polls around the trend estimate.

The "But..." in the title of the post is because it appears there is a new AP/Ipsos poll with approval of Bush at 33%. An AP article on economic confidence mentions this approval result, but so far I've not seen an official release of presidential approval from the new AP/Ipsos poll. Because the AP/Ipsos approval number is not yet "official" (in my book at least) I will not do a post on it yet.

However, it would be deceptive to pretend I am unaware of that result. So, the "But..." is that this AP poll should be officially released by AP soon. When that happens, and assuming the correct number actually is 33% (I assume it will be, since it was cited by an AP reporter, but you never know for sure until the release is out), then the trend estimate WITH AP will be 27.8%, rather than 27.2% with only the new Harris. BUT since AP decided to use the number in a story prior to releasing the official result, it is not yet certain (to me) that this will be their result. (Perhaps final processing of the new AP/Ipsos approval poll is not yet final, and a different result appears. But if so, I am surprised it was allowed to be used in a story.)

The bottom line is that either way approval continues in the upper 20s, and that certainly remains bad for the administration.

With the Harris poll (but NOT AP) there are not concerns in the diagnostics below, and the recent polling continues to follow the trend as we would expect.


Tuesday, July 10, 2007

McCain's Collapse


News broke today of a major shakeup of the McCain presidential campaign. This on the heels of a second poor financial quarter and a mere $2 million cash on hand. The financial and staff disaster however simply reflects the trouble the campaign was in with voters.

While McCain was widely said in 2005 and 2006 to be the front runner for the Republican nomination, he consistently polled a few points behind Rudy Giuliani in that period. Since January of 2007, McCain's national level of support from Republican voters has steadily declined from nearly 25% to just over 15%.

That national decline would be bad enough for any campaign, but the situation in the early primary states has been even worse. The most dramatic failure has been in South Carolina, the state where McCain invested most heavily and where he did the most politically to mend fences demolished in the 2000 campaign. McCain's frequent visits, staff allocation and public shifts to reposition himself vis a vis South Carolina political issues and political and religious leaders initially paid off in support from around 40% of Republicans in the state as of early 2006. But the trajectory of support there has been profoundly down, standing today at around 17%.

In New Hampshire, the launch pad of the 2000 campaign, McCain has also steadily declined, from around 35% in early 2006 to half that--- 18%--- now.

In Iowa, the state McCain wrote off in 2000 and initially tried to win this time, support has crashed from 25% to under 10%.

And in Florida, the big state that moved up its primary this year, McCain has dropped from a high of 27% to 12%.

The collapse of campaigns can be attributed to poor strategy, poor management, poor fundraising. But the more fundamental cause is lack of support, a failure to connect with voters. The trajectory of the McCain campaign has been clear in these data for some time. Republican voters were simply not embracing the McCain candidacy. That was evident during his "front runner" period when journalists couldn't believe Giuliani's lead in the polls meant McCain wasn't the front runner. It became more evident as Giuliani surged in early 2007 while McCain started to decline. And it is stunningly clear now as Republican voters have been deserting the campaign in state after state after state. (Note Giuliani's trajectory is now similar to McCain's. A topic for another day.)

Maybe different management would have raised more money and spent it less profligately, but only a message more attuned to Republican voters' preferences and concerns could have changed this campaign. Given McCain's positions over the past 7 years, perhaps no message could have been crafted that would have bonded voters to him. Only a miracle of Biblical proportions is likely to bring this one back.

Bush Approval: Gallup at 29%, Trend at 27.7%


The USAToday/Gallup Poll taken 7/6-8/07 has found approval of President Bush at 29%, disapproval at 66%. This is the first time Gallup has found approval of President Bush below 30%. My approval trend estimate now stands at 27.7%.

While other polls have fallen into the 20s in recent weeks, Gallup had not done a survey since mid-June. Gallup on average falls 1.26 percentage points above the trend estimate, so the new reading is quite consistent with both the trend and the house effect.

The trend estimate has now held below 30% for the last 7 polls, despite two of those polls coming in at 31% and 32%. Unless something reverses the current downward trend, it is likely that President Bush will see a range of polling over the next couple of weeks ranging from 23% to 33% but with most in the 20s. That is a poisonous level of support for Republicans in Congress, where support for the President's policies has continued to erode.

Republican support in the latest poll is at 68%, only the 2nd time Gallup has found Republican support below 70% during the Bush administration.

Other indicators in the new poll are also bleak for the White House. A full 66% in the poll say Bush should not have intervened in the Libby case, with 13% saying commutation was the right thing to do, while 6% would have preferred a full pardon. This confirms earlier "instant" polls that found low levels of support for the commutation. And for the first time, over 60% of the sample says that it was a mistake to invade Iraq: 62%.


Sunday, July 08, 2007

Bush Approval: Newsweek 26%, Trend 27.9%


A Newsweek poll taken 7/2-3/07 finds approval of President Bush at 26%, disapproval at 65%, unchanged from Newsweek's previous poll done 6/18-19. With the addition of the Newsweek poll, the trend estimate stands at 27.9%.

This Newsweek poll was completed on the day the commutation of Scooter Libby's prison sentence was announced, so most respondents were interviewed before that news broke. With the 4th of July holiday interrupting most polling operations, new approval ratings taken entirely after the commutation will only become available this coming week.


Four of the six most recent polls (including two by Newsweek) are typically below trend, with two tending to fall above trend. It will be revealing to see some new polls from those with typically positive "house effects". While those could be as high as 33%, given my current trend estimate, we should expect Gallup to fall between 29% and 31%, given current trends and Gallup's typical house effect. ABC/WP who hasn't been heard from in a while might be expected at 29-32. It will be revealing if either comes in below (or more surprisingly, above) those ranges.

The current Newsweek poll is 1.9 points below trend, well within the range of normal variation. (There are two Newsweek polls in the residual plot below, with the lower Newsweek being the earlier June poll, though it too is well within normal limits.)

The rest of the diagnostics continue to support a continuing decline in support since late April. The Libby commutation, or the immigration bill's defeat, might have shifted the trend-- but which way? Arguments have been made both ways. We need a number of new post-Libby polls to detect whatever effect there may have been. Stay tuned.


Friday, July 06, 2007

ARG and others on Impeachment


American Research Group (ARG) asked 1100 respondents 7/3-5/07:
Do you favor or oppose the US House of Representatives beginning impeachment proceedings against President George W. Bush?

The results found 45% in favor and 46% opposed, with 9% undecided.

Those are striking numbers, but deserve a bit of context.

First, as anyone would expect, there are sharp partisan divisions on this question, with 69% of Democrats, 50% of independents and 13% of Republicans support impeachment proceedings. One might wonder if 13% of Republicans supporting the impeachment of their president is really a credible estimate here. It seems large, given continued Republican support for President Bush in job approval in comparison to that of Democrats and independents.

Likewise, we might wonder if support for impeachment has risen in the immediate aftermath of the Libby sentence commutation.

ARG asked an impeachment question in a poll taken 3/13-15/06. Those results are shown in the top right panel of the plot. There the findings were 42% in favor and 49% opposed. (There was a slight difference in question wording as well.) In that March poll, 61% of Democrats, 47% of independents and 18% of Republicans favored impeachment. So this comparison suggests a small increase in support overall, and among Dems and independents, and a small DECREASE in support for impeachment among Republicans since the March survey. But these are modest changes, not large increases in impeachment sentiment.

One might also ask if the ARG survey results are typical of responses in other polls. There the answer is no, the ARG results show more support for impeachment than other polls do.

At the same time as the ARG March survey, Newsweek's poll taken 3/16-17/06, used a slightly different wording but found 26% in favor of impeachment, 69% opposed, well below the 42% ARG found at that time. Newsweek also found very low levels of support for impeachment among Republicans (5%) which seems more reasonable to me. Like ARG, the Newsweek survey found large partisan variation, though with less impeachment support in each partisan category than in the ARG survey (49% Dem, 23% Ind, 5% Rep.)

As for trend over time, the latest poll prior to the new ARG that asked about impeachment was a Time/SRBI poll taken 11/1-3/06, just before the election. That appears in the bottom right of the plot. Their results were 25% in favor, 70% opposed and 5% undecided, VERY similar to the March Newsweek results. Finally, the breakdowns by party in the Time/SRBI poll are also similar to the earlier Newsweek: 48% Dem, 22% Ind, and 4% Rep in favor of impeachment.

The conclusion is that there is little evidence for a substantial increase in support for impeachment, over the past 16 months, and the ARG results appear to be at the high end of support in comparison to other polling. It would be nice to have another new poll to compare with the current ARG results to see if this pattern has continued.

ARG Poll on Libby Sentence Commuration


American Research Group (ARG) has completed a poll taken 7/3-5/07 on President Bush's decision to commute the jail sentence of Scooter Libby. The results are similar to those of the "instant" poll by SurveyUSA taken the night the decision was announced.

ARG asked
Do you approve or disapprove of President George W. Bush commuting the 30-month prison sentence of I. Lewis "Scooter" Libby while leaving intact Mr. Libby's conviction for perjury and obstruction of justice in the CIA leak case?
The results are strongly structured by party identification, which is certainly no surprise. Only 13% of Democrats and 19% of Independents approved of the commutation, while 50% of Republicans approved. However, as with the SurveyUSA poll, a substantial fraction of Republicans disapproved-- 47% in the ARG poll. Unfortunately, we can't tell for sure how many of these disapproved because the wanted a full pardon compared to how many disapproved because they wanted Libby to serve out his sentence. The survey did ask if respondents favored a pardon, but the news release (so far at least) has not given the cross tab between these two questions which would let us know how these two different reasons for disapproval break out. Perhaps that will be released later.

The high levels of disapproval among Democrats and Independents is not surprising, but the high disapproval among Republicans is surprisingly high.

When asked if they favored a full pardon for Libby, 23% of Republicans said they did. If we make the extreme assumption that ALL of these said they disapproved of Bush's commutation, then 47%-23%=24% of Republicans disapproved the commutation AND did not want a pardon, implying they thought Libby should serve his jail sentence. This is certainly an underestimate since it is doubtful that the pro-pardon group were entirely in the disapprove of commutation category, but it at least sets a lower limit on support for jail among Republicans. As with the SurveyUSA poll, this suggests a significant fraction of Republicans thought Libby should serve time in jail.

The distribution of opinion on the pardon question (text: "Do you favor or oppose a complete presidential pardon for Mr. Libby?") is shown below:


Only 7% of Democrats and 2% of independents favored a pardon, compared to 23% of Republicans. A still large 70% of Republicans opposed a pardon, while 7% said they don't know. The independents in this sample are surprising for how overwhelmingly hey opposed a pardon, even more so than Democrats (82% Dem, 97% Ind.) That is puzzling enough that I'm not sure I believe the 97% number. It is NOT due to small sample size, because independents make up 33% of the ARG sample. The SurveyUSA poll didn't find Independents so much more extreme than Democrats on a pardon. Almost always we find independents between Dems and Reps on partisan questions like this, so I can't explain why independent opinion on this question would be so unanimous, when even Democrats are at least a bit more willing to see Libby pardoned. I'll hold out a possibility of a typo in the web page on this one. If correct, it is awfully huge opposition to a pardon among independents.

Compare these plots with those for the SurveyUSA poll here.

There will surely be some new polling data taken or reported over the weekend on this, so we should learn more on how opinion is shaping up on this issue by Tuesday.

Monday, July 02, 2007

Opinion on Libby Sentence Commutation


SurveyUSA has a poll of immediate reaction to President Bush's decision to commute the prison sentence of Scooter Libby. SurveyUSA uses Interactive Voice Response (IVR) "automated" polling rather than human interviewers. But for a quick reaction poll of a breaking news story, this poll shows the advantages of speed that are possible with IVR technology.

SurveyUSA interviewed 1500 adults nationally within three hours or so of the news that President Bush had commuted the sentence. Of the full sample 55% (825) said yes to the question: "Are you familiar with the legal case involving former White House employee Scooter Libby?"

Those 825 were then asked
President Bush has commuted the portion of Scooter Libby's sentence that would have required Libby to serve 30 months in prison. Libby remains a convicted felon - he still must pay a 250 thousand dollar fine and serve 2 years of probation - but he will not go to prison. Based on what you now know, should the President have pardoned Scooter Libby completely? Should the president have taken no action, and left the prison sentence in place? ... Or, do you agree with the president's decision to commute the prison portion of the Libby sentence?
As SurveyUSA points out, an advantage of the instant poll is that it can measure opinion before the inevitable political spin begins to affect opinion.

One problematic issue is that SurveyUSA filtered respondents for awareness of the Libby case. I suspect a number of polls to be taken over the next few days will vary in whether the filter for awareness or not, making direct comparison among all the polls to come somewhat difficult. By applying this filter, SurveyUSA should be expected to include people with greater awareness of the issues in the Libby case and presumably more settled opinions on this case than if they had included all 1500 respondents, including the 45% who said they were not familiar with the case. Given the discussion the Libby case has received on talk radio, blogs and MSM it is interesting that 45% didn't feel they were familiar with the case. This opens considerable opportunity for opinion to be swayed either direction in the next couple of days.

But what of those who were familiar?

Not surprisingly, 79% of liberals wanted to see Libby serve his sentence, with only 9% approving Bush's decision and 11% wanting a full pardon. Moderates were only a little less bent on punishment: 69% wanted prison time, while 19% approved the commutation and 11% wanted a full pardon. But what surprises me is the Conservatives. They broke into rough thirds: 31% wanted a complete pardon and 31% approved the decision, but a surprising 35% thought Libby should have served his prison sentence. For all the talk of the President needing to respond to a conservative base fired up for a full pardon, this evidence suggests the President has failed to satisfy two-thirds of that base. (And one should always remember that what we hear on conservative talk radio is a substantial exaggeration of the homogeneity of opinion within that base. Grass roots conservatives (as with grass roots liberals) are considerably more variable in their opinions than radio shows would suggest.)

If we shift to partisanship we see a similar but not identical distribution. Democrats favored prison by 77%, approved the commutation by 14% and 8% thought a full pardon was called for. Fifty-six percent of Independents wanted jail, with 20% approving the President and 21% wanting a pardon. But again when we come to the Republican base, we find a really surprising 40% saying the Libby should have served time in prison. Thirty-two percent supported Bush's decision while 26% wanted a pardon.

Now we might expect to see lowering of support for prison among conservatives and Republicans over the next few days as Republican opinion leaders send the message that they support the commutation (assuming they send that message). And it will be interesting to see if subsequent polling agrees with this instant snapshot from SurveyUSA. But the commentary going into this action by Bush stressed the dilemma he faced between satisfying the base and further offending independents and moderates. So far, the evidence is that the action he took has failed even to please a majority of the Republican and conservative base.

This should be interesting to watch.


Revision: This version of the graphics scale the column widths in proportion to the size of each group (Lib,Mod,Con) or (Dem,Ind,Rep). The first plots failed to do that. My bad. Thanks to Peter Flom for bringing the mistake to my attention.

Sunday, July 01, 2007

The Top Candidates in the First Five States

Updated 11/15/07

Democrats:


Republicans:


(These graphs will be more clear full size: click once or twice for full resolution.)

This post gives an alternative view of the top candidates in both parties in the first five primary and caucus states. The data are the same as in my state-by-state view of the primaries (see the links in the column to the right), but here you can see each candidate across all five states. This allows easy comparison of one candidate across all states (reading across each row), as well as across candidates within states (reading down each column).

The dates of each state's primary or caucus are what is currently expected, but are subject to change.

This post will be updated in place. Look for a link in the right-hand column of links.