Tuesday, April 22, 2008

Final Pennsylvania Updates


Clinton has increased her lead in the trend estimates over the course of the last polls to 6.6 points using the standard estimator, and to 8.4 points using the sensitive estimate. Last minute polls have given her bigger margins.

Now the key question is whether undecideds push her over a 10 point win, or whether increases in turnout by new "unlikely" voters raises Obama's total.


Still a good bit of variation and some pollsters see a strong trend, others not so much.


Pollster variation doesn't make a lot of difference in our trend estimates.

But remember, since the polls don't allocate undecided, both they and the trend estimates are leaving some 8 percent of voters on the table. They will go somewhere, and if they break disproportionately for Clinton you have a "huge win", while if they go overwhelmingly for Obama you have a nail biter or a dramatic come-from-behind win. In previous primaries, the "winner" has usually enjoyed a significant increase in support beyond what the last polls showed.

Monday, April 21, 2008

Pennsylvania Undecided Voters


Senator Clinton currently holds a 6 point lead over Senator Obama in Pennsylvania, based on our Pollster Trend Estimate, 49%-43%. But that leaves about 8 percent undecided. What they do will determine whether Clinton's vote expands her lead compared to the polls, or if the undecided narrow or possibly reverse, the lead.

My partner at Pollster, Mark Blumenthal, has looked at this using aggregate polling data here and in his NationalJournal.com column here.

In this post I take a look at the individual level, though using data that are three weeks old, so use caution in extrapolating to tomorrow's electorate.

Using data from the Time/SRBI poll of Pennsylvania, conducted 4/2-6/08, I estimate a model of support for Obama compared to Clinton. I use "the usual suspects" as variables predicting vote: partisanship, gender, race, Hispanic ethnicity, region of the state, age, education, religion and income. The data at that time found an eight point Clinton lead, a bit higher than today's trend estimate.

Using the coefficients for "decided" voters, I can estimate the probable vote of the undecided 11% of voters in the poll. This gives us a look at how they would be expected to behave IF they behave like those who have already picked a candidate. (Note the "if" here. As with all models, this assumes stable influence of the variables among the undecided as among the decided.)

The plot above shows the distribution of estimated probability of voting for Obama. Values close to zero are very likely to support Clinton, while values close to 1 are very likely Obama supporters. Those close to .5 are flipping a coin. The shape of the distribution gives a sense of where voters "lump up" in their estimated preferences.

The black line plots the distribution among those who reported a vote preference. The red line plots the distribution of estimated support among those who said they were undecided in early April.

The key point is that the undecided resemble the decided, with a small shift to the left, suggesting they were as a group somewhat more likely to support Clinton. In these data, the primary difference between undecided and decided voters was age, with older voters more likely to say they hadn't decided. As we've seen in virtually every exit poll, older voters are more likely to support Clinton, so the result we find here, that the undecided lean a bit more towards Clinton, is consistent with this result.

Now again for the caveats. These data are three weeks old. The model requires the assumption that undecided voters ultimately behave like those who decided. Different variables as predictors can make a difference. And so on.

The goal here is NOT, NOT, NOT a prediction of tomorrow's vote. Much may have changed since the first week of April.

The point is to illustrate what we can learn about undecided voters beyond the simple fact they say "undecided". In this case, the data suggest they are not wildly different from those who decided, but their older age makes it more likely they ultimately lean more to Clinton.

The Time/SRBI data are archived at the Roper Center for Public Opinion Research. I am solely responsible for the analysis here.

Pennsylvania Pollster Comparison


Judge for yourself.

Day Before Pennsylvania Sensitivity Update


The Pennsylvania race has turned slightly toward Clinton over the weekend, with her lead now at an even 6 points in our standard trend estimate. If you believe in taking more chances with random noise, the sensitive estimator has a 6.4 point Clinton lead.

In the rush of new polling over the weekend, it is also good to check how much any of them may be affecting our estimates.


Dropping any single pollster makes only a bit of different to our estimates. The Clinton trend ranges from 48.5% to 49.6%, while Obama ranges from 42.6% to 43.5%. So dropping your least favorite pollster can, at most, account for the difference in a 5 point race and a 7 point one.

And note that we still have about 9 percent undecided. I wonder what they will do?

Saturday, April 19, 2008

National Dem Trends, Newsweek Poll


A new Newsweek poll gives Barack Obama a 54%-35% lead over Hillary Clinton among Democratic voters (story here, detailed results here, and thanks to Newsweek and their pollster, Princeton Survey Research Associates International, for a full and complete disclosure of the details of their survey. A model others should be encouraged to follow.)

The Newsweek poll raised a few eyebrows for its 19 point Obama lead, considerably more than other recent polls, and beyond the 10.4 point Obama lead in our trend estimator. However, a closer look at recent data shows that Newsweek is not far from other recent data. Newsweek is the 6th poll in April with Obama at or above 50%, while five April polls put him below 50%. With Clinton, Newsweek is the 4th April poll putting her at or below 40%, while eight polls have her above 40%. So Newsweek shows a larger Obama lead than others, but it is not as far out of line as may first appear. (Note in the counts of polls above, we only count independent samples of the Gallup daily tracker, so dont' count each of their daily results as new polls.)

As you can see from the plots below, we've not seen many recent outliers in the national Democratic nomination polling, and the new Newsweek is well within the 95% confidence interval.


All that said, our trend estimate for the race puts Obama at 50.2% and Clinton at 39.8%, a significant gain for Obama during the month of April. Since late March, Clinton has suffered a somewhat greater downward slope while Obama's gains have been a bit more shallow, implying a slight gain among undecided voters.

The Newsweek poll also has some interesting internal results. As with virtually all this year's polling, Obama has a substantial lead among Independents who will vote in the Democratic primary or who lean Democratic: 61% to 28% for Clinton. What is a key to Obama's strength in the Newsweek poll is he ALSO leads among self-declared Democrats 51% to 38%, a group Clinton has won in most contests. If real (and I want to see more data before I accept this change) then Obama may be winning the consensus among party rank and file that will be key to persuading Superdelegates to move strongly in his direction. So long as he trails among the strongest party identifiers, that case is less persuasive. Pennsylvania provides a new test of this possible change in support. (Obama continues to trail in our Pennsylvania estimates, so it is unlikely he has so far persuaded a majority of Democratic identifiers there, though stay tuned for Tuesday's exit polls.)

The other important shifts in this national Newsweek poll is that Obama leads among men 57%-31% but also among women 52%-38%. Again this would represent an important gain among women.

The age gradient in Obama support has been interesting all year. In the Newsweek poll, he wins 18-39 year olds by 62%-28%, as usual, but also wins 40-59 year olds by 54-36%. In past exit polls, his "break even point" has varied among age groups from as low as 40 (i.e. losing all groups over 40 years old) to as high as 59 (only losing those over 60 years old.). More astonishing here is he gains a plurality of those over 60, 47%-41%, which if true would be his best performance among older voters all year.

The area of the Newsweek poll where Obama still suffers is among working class or poor whites, where he trails badly, 35%-54%. In contrast he leads 52%-35% among upper and middle class whites. That class divide remains a critical issue for his campaign.

A caution here as well. In any poll with such high overall support, the support almost has to reach across many subgroups (not quite as a mathematical certainty, but as a strong empirical regularity.) So we should be careful not to accept the depth of Obama's support among Democrats, women and those over 40 years old until we have more evidence from additional polling. In the exit polls this year, where we see big Obama wins (VA, MD, WI) we also saw him making strong inroads among these groups. But with the margin he achieved in these states, it would have been hard NOT to have done well across groups. Be careful of the cause and effect attributions here. It is a challenging state like Pennsylvania that can reveal how deeply into the various demographic groups Obama has managed to extend his appeal. But with those cautions, Newsweek's poll shows some evidence that the national Democratic constituency is moving in his direction across a number of groups.

If these changes are real, we'll see new polling that reflects it. If just a favorable poll (though not an outlier!) then new polling will show that these groups are not quite as enthusiastic for Obama as the current poll suggested.

Friday, April 18, 2008

Pollster Effects on Pennsylvania Trends


There is a lot of interest in the differences among pollsters, and especially what effect they have on the perception of the race. Here at Pollster, the interest is specifically on the question of whether individual pollsters drive our results, and if so by how much.

So here is a quick look at those effects in Pennsylvania's Democratic primary.

The chart above shows the trend estimates that result from dropping each pollster in turn, and reestimating the trend without that pollster. This is a specific test of how much it matters whether we include a particular pollster or not.

Over the 15 pollsters we have represented in Pennsylvania, the estimates excluding each one for Clinton range from 46.6% to 48.3. The estimate with all pollsters included is 47.4% for Clinton.

For Obama, the estimates range from 41.2% to 42.5%, with the estimate for all pollsters at 42.0%.

The upshot is that pollsters do matter, but none drive the results by very much. A 1.7% range on Clinton and a 1.3% range on Obama for the trend estimate is very small compared to the range we see across the raw poll results. Another example of the greater stability of the trend estimators we use compared to the substantial variability across polls.

We can look at the effects of each pollster by comparing the trend estimate without that pollster to the estimate with them. The higher the effect, the more that pollster drives our trend estimate up for that candidate. Negative effects means the pollster drives our estimate down. Again, this is compared to the trend with and without the individual pollster.

The two charts below show these effects for Clinton and for Obama.


For Clinton, SurveyUSA has the highest positive impact on our trend estimate, followed by Rasmussen. At the opposite end, PPP has the largest negative effect on our trend, with Zogby/Newsmax the next largest negative effect. Other pollsters are clustered rather closely around zero.

And it is important to note that even the four largest positive and negative effects are all less that 1 percentage point.


For Obama's trend, Quinnipiac shows the largest positive effect, followed by Zogby and PPP with near identical effects. On the negative end, SurveyUSA has the most negative effect of Obama trend. Again, none of these effects is as much as one percentage point, and SurveyUSA's is less that half a percentage point. Other pollsters have less impact.

We can also look at the joint effects. These are the same as seen individually above but plotted against one another.


Pollsters do matter, and outliers matter even more. But the net effect of any individual pollster on our trend estimates in Pennsylvania are modest, especially when viewed in comparison to the wide range of raw poll results for each candidate. Another advantage of combining information across polls rather than pick single polls we "like".

Pennsylvania Dem Sensitivity Comparison


Here is an update on the Pennsylvania Trend Estimates for both the standard estimator and the more sensitive one.

The difference is small: 0.3 for Clinton and 0.8 for Obama. But hey, it can be a game of inches. Either way it looks like about a 5 point margin right now.

(See earlier posts for details on the standard and sensitive estimate. The sensitive is about twice as responsive to the data, but tends to chase ghosts.)

Monday, April 14, 2008

Pennsylvania Dem Trend Sensitivity


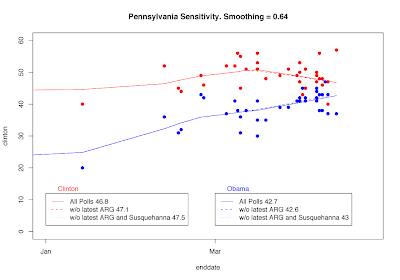
Time for a look at the sensitivity of our trend estimators. ARG has a new Pennsylvania poll out showing a 20 point Clinton lead. But Susquehanna Polling has one completed three days earlier with a 3 point Clinton lead and Zogby has one on the same day with a 4 point Clinton lead. Did things shift that swiftly or do we have an outlier?

Our standard trend estimator is designed to resist outliers, and it manages to do so in this case (see the chart above.) With or without ARG (and with or without ARG AND the close Susquehanna poll) the trend estimates only change by 10ths of a percentage point. What does change slightly is the slope of the trend estimate between the solid line with all polls and the dashed and dotted lines without ARG and without ARG and Susquehanna. In fact, the changes are slight enough you need to squint to really see them.

It may surprise you that removing ARG makes Clinton's trend estimate go UP, when you would understandably expect it to go down. The reason is simply that she is trending down either with or without ARG. Removing ARG means that the latest poll for the trend estimate is 3 days earlier, hence higher up on the downward trend. Since ARG doesn't much affect the slope, removing it just "backs the trend up" by three days, making Clinton a tiny bit better off. The same happens in reverse for Obama-- without ARG he is a shade worse off (0.1 percentage points) because his trend is rising either way, so backing up 3 days hurts him a tiny bit. (Removing ARG and the close Susquehanna poll makes similarly modest changes to the trend estimate.)

So for our standard estimator, whether we include or exclude the latest ARG poll makes very little difference.

That is by design. At this point a single new poll that shows a big change should be regarded with caution. It MAY reflect a big shift over the weekend. But it could just as easily be a statistical fluke that will not be replicated in other new polls. Until there is more evidence one way or the other, the trend estimate is designed to not chase after a single poll far away from the other data. But if we get two or three more polls showing similar results, the trend estimator will then be convinced the shift is real, and will turn in the direction of the new data.

But what if we decided to be less cautious and more willing to respond to new polling? For that, we have an alternative estimator that is about twice as sensitive. This one will pick up new trends much more quickly, but will also be misled by a single outlier much more easily. Let's see what this more sensitive estimator thinks is going on.


With the sensitive estimator, the ARG poll makes a HUGE difference. It shifts the difference in trends from a 4.3 point Clinton lead to a 12.6 point lead! That is really responsive. But it also demonstrates what a large difference a single poll can make when we crank up the sensitivity of the trend estimator.

What is more interesting with the sensitive estimator is that taking out ARG, we see a flattening of Obama's trend and even a tiny downturn, though also a continued decline for Clinton. If we also take out Susquehanna we find Obama continuing to rise but Clinton falling at a slower pace than without ARG alone. (You really have to squint to see the dotted line. Sorry about that.) Clinton leads by 4.2 without ARG AND without Susquehanna, by 4.3 without ARG alone.

So perhaps the sensitive estimator is showing us something new-- Obama may have flattened or even turned down a shade recently, but if so Clinton seems to have continued to decline as well. This also illustrates why we prefer our more conservative estimator. The sensitive version is just too dependent on individual polls at the end of the series. It provides a possible early hint of things to come, but is too unstable to count on. Our standard estimator may be a little slow to pick up a change of direction, but it seldom chases after random noise.

As for ARG's result, let's wait a day or two and see what other polls have to tell us and how our estimator responds.

For an animation of the Pennsylvania sensitivity analysis for a wide range of sensitivity, download this Acrobat file and use the arrow keys to control the animation speed.

Friday, April 11, 2008

Bush Approval Falls to 28.3%


President Bush's approval trend has taken a sharp downturn in recent weeks, to fall to a new low for the administration at 28.3%. This follows a lengthy period of stable approval at around 32-33%.

Recent polls from Gallup and AP/Ipsos put approval at 28%, a new low for the Gallup poll. Harris recently found approval at 26% while CBS News put approval at 28%. Pew similarly has approval at 28%, though the Diageo/Hotline result for registered voters (as opposed to adults in the other polls) has approval at 35%, the only recent poll over 30%.

While the President has taken a back seat to the primaries in recent months, his new approval slump reflects growing pessimism over the economy which has displaced the war in Iraq as the most important problem facing the country. Likewise the percent saying the nation is headed in the wrong direction has continued to grow in recent months, to a high of 81% in a recent CBS News poll.

Wednesday, April 09, 2008

Most Important Problem, 2005-2008


The Iraq war and the economy have consistently been the top two "most important problems" facing the nation during President Bush's second term. But the dynamics have changed dramatically over the past seven months.

After near parity in 2005, the war dominated throughout 2006 as far more important that the economy, and with rising numbers of people citing the war as most important. That peaked in early 2007 with concern over the war gradually diminishing through most of the rest of the year.

And then the economy struck. As recently as August 2007 only 8% said the economy was the most important problem. By early September that jumped to 13%, then to 23% in January and now 37% in early April. By contrast the war fell from 34% to 15% over that same time.

It will be ironic if the fall campaigns largely ignore the war to focus on an economy that 12 months earlier had looked fairly good.