Thursday, September 29, 2005

Roberts Confirmation Vote


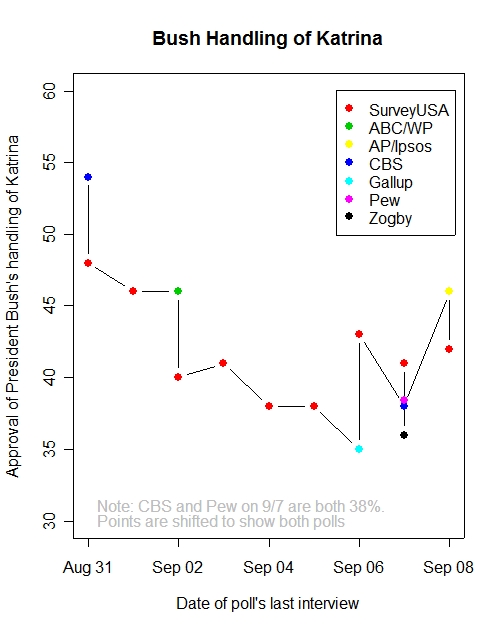
Votes against confirmation of Supreme Court nominees, 1953-2005 Posted by Picasa

Chief Justice Roberts was confirmed today on a 78-22 vote in the Senate. Coincidentally, this vote margin resembles the votes on the man he replaces, the late Chief Justice Rehnquist. Rehnquist was initially confirmed as an Associate Justice by a 68-26 vote in 1971. His elevation to Chief Justice in 1986 drew more opposition, 65-33.

Roberts drew about double the opposition that recent appointees have faced, with the exception of Rehnquist and Justice Thomas, who was confirmed on a 52-48 vote in 1991. (Fortas2 in the figure is a cloture vote in 1968 which failed. President Johnson withdrew the nomination, and Fortas resigned from the Court the next year.)

In the Roberts case, confirmation was assured by the united Republican majority despite pressure from Democratic interest groups which urged "nay" votes from Senators of their party. In the end, 22 of the 44 Democrats voted against the Roberts nomination.

And here is who voted how, among the Dems. (Not sure why the spacing is bad here.)


Dem-Yes Dem-No
Baucus, Mont. Akaka, Hawaii
Bingaman, N.M. Bayh, Ind.
Byrd, W.Va. Biden, Del.
Carper, Del. Boxer, Calif.
Conrad, N.D. Cantwell, Wash.
Dodd, Conn. Clinton, N.Y.
Dorgan, N.D. Corzine, N.J.
Feingold, Wis. Dayton, Minn.
Johnson, S.D. Durbin, Ill.
Kohl, Wis. Feinstein, Calif.
Landrieu, La. Harkin, Iowa
Leahy, Vt. Inouye, Hawaii
Levin, Mich. Kennedy, Mass.
Lieberman, Conn. Kerry, Mass.
Lincoln, Ark. Lautenberg, N.J.
Murray, Wash. Mikulski, Md.
Nelson, Fla. Obama, Ill.
Nelson, Neb. Reed, R.I.
Pryor, Ark. Reid, Nev.
Rockefeller, W.Va. Sarbanes, Md.
Salazar, Colo. Schumer, N.Y.
Wyden, Ore. Stabenow, Mich.


Wednesday, September 28, 2005

The Long View of Gas Prices


Annual gas prices, 1949-2005 Posted by Picasa

Barry Burden's comment to the previous post drew my attention to a longer run gas price series (Thanks Barry!) and to a nice graph of the data by Professor Robert Sahr at Oregon State University. I've updated his graph to include 2005 prices (so far) and convert the real series to 2005 prices. I've also kept the distinction between leaded and unleaded, so you can see the modest differences.

That graph above shows the long run decline in real prices until 1998, with notable exceptions for the 1974 shock and the 1979-1985 period.

It is interesting to compare the 1974-1981 real prices with the 1998-2005 real prices. In both cases a short run-up, a modest decline and a large spike in prices. In real terms we are still a bit ahead of the $2.33 peak in 1981, with 2005 prices averaging $2.19 for the first 9 months of the year. But the dynamics of prices, and the political implications, remain interesting.

And of course the unanswered question is whether we will see the same sharp decline in real prices that the 1980s had.

By the way, note that the Sahr graph is very well documented. The source and technical notes are clear and the graph is less jumbled than my own. Perhaps more important for visual impression of the trends, compare his "landscape" graph with my "portrait" one. My narrower graph makes the up-and-down dynamics appear stronger. His wider graph, makes these trends appear less dramatic. Same data, so no "real" difference, but perhaps an important psychological effect that may matter for how we interpret the data. Mine is what those who point with alarm would like to stress, while his flatter graph suggests less reason to panic. Mine also looks more alarming because the price rise in 2005 makes the end point rise dramatically compared with his 2004 endpoint.

Here is my graph in a more landscape aspect ratio for comparison. Neither is "right" or "wrong" but we all need to be aware of how visual perception of the same data can affect our interpretations.


A "landscape" view of gas prices. Posted by Picasa

Data Source: Energy Information Administration AER Table 5.24 (bottom of the page). I adjusted the data for 2005 prices based on the June 2005 CPI, excluding energy and averaged weekly nominal prices for 2005 to get the annual estimate for 2005. That obviously will change over the rest of the year.

About those gas prices...


U.S. gasoline prices, 1990-2005. Posted by Picasa

We've all paid at the pump, but what does the actual data look like? Here are the nominal and real price series for regular gas, since 1990. The data are weekly averages for the U.S. from the U.S. Department of Energy. The real prices are calculated based on the CPI (EXCLUDING energy, and seasonally adjusted) with $1.0=August 2005.

Oh, and that vertical line in the graph, that's when I bought my SUV. Good timing, huh?

(P.S.-- This is a revised graph. Wrong real price variable earlier. Ugh. It was too late to post, I guess.--chf 9/28)


What about regional variation in pricing? Here it is, in nominal prices.


Regional Gas Prices (Nominal prices), 1990-2005 Posted by Picasa

As you can see, there is a bit of regional variation, but the correlation across regions is quite high.

Data: DOE Gas Prices are here.
The CPI is from FRED (at the St. Louis Federal Reserve), here.

Tuesday, September 20, 2005

The bad news: Katrina is the GOOD news.

Of the results in the latest Gallup/CNN/USAToday poll, the following must surely be the worst for the White House: The President's handling of the Katrina aftermath is his HIGHEST approval rating. USAToday reports the following table:


2. Do you approve or disapprove of the way George W. Bush
is handling the following?


ApproveDisapprove
The response to Hurricane Katrina4157
Overall job approval4058
Foreign Affairs3858
The economy3563
The situation in Iraq3267


(See the full results of the poll at USAToday here.)

In short, President Bush's standing with the public is currently being driven down not by the unique and unexpected events of Hurricane Katrina, but by his handling of the economy, foreign affairs and Iraq. That is much worse news than problems at FEMA, and cannot be easily cured with reconstruction programs for the Gulf coast.

Overall Job Approval, updated to 9/18.


Overall Presidential job approval, as of 9/18 Posted by Picasa

The lastest national polls have continued to report the lowest approval ratings of President Bush's administration. The graph adds three new polls, from CBS/NYT (9/9-13/05, App: 41, Disapp: 53), Fox/Opinion Dynamics (9/13-14/05, App: 41, Disap: 51), and Gallup (9/16-18/05, App: 40, Disapp: 58). The AP/Ipsos poll (9/16-18) appeared after I mdae the figure, but doesn't change the results: App: 40, Disapp: 57.

With these new polls added, my model of approval estimates a Katrina impact of -1.48, which is now solidly statistically significant. Alternative models produce estimates from -1.35 to -2.10.

I've also added a lowess (local regression) trend line (in red) to the plot, as suggested by Robert Chung (thanks!). You can easily see the shift in the local fit since Katrina hit. Robert has an excellent discussion of polling house effects here.

The interesting question will now become whether this Katrina impact will be short lived or if it will represent a permanent shift in the President's approval rating. More on that shortly.

Bush Katrina Job Rating Remains Stable (9/19)


Approval of President Bush's handling of Katrina, through 9/19. Posted by Picasa

Approval of President Bush's handling of Katrina has remained stable over the past week to 10 days, according to polling from ABC/WP, CBS/NYT, SurveyUSA, Gallup and AP/Ipsos. The local regression fit (lowess) plotted in red has stabilized and remained quite flat over the last several polls.

The good news for the President is that the initial decline has been arrested and slightly reversed from the low of approval, around Sept. 7. The bad news is that the President's speech on September 15 appears to have done little to improve the image of his performance.

Thursday, September 15, 2005

Post Katrina Job Approval of President Bush (as of 9/13)


Overall approval of President Bush's job as president, through 9/13 Posted by Picasa

Five polls have come in since the last update, so time to take another look at approval of President Bush, and the post-Katrina effect.

Gallup, Pew/PSRA and ABC/WashingtonPost were all in the field 9/8-11. The approval ratings are Gallup 46%, Pew 40% and ABC/WP 42%. That is unchanged for Pew since their 9/6-7 poll, and down 3 points from 45% approval in ABC/WP of 8/25-28, just before Katrina made landfall. Gallup, on the other hand, shows a 1% gain in approval from 8/28-30, partially after landfall but before the magnitude of the disaster was clear. See MysteryPollster.Com here for comments on the general downward trend in polls between July and now, along with a familiar looking graph.

The two latest polls are NBC/WSJ/Hart-MacInturff 9/9-12 and CBS/New York Times, 9/9-13, at 40% and 41% approval respectively. For NBC/WSJ that is a drop of 6%, from 46% in an elderly poll taken 7/8-11. For CBS/NYT the change is a drop of 1% from the CBS poll of 9/6-7.

So four of the five polls show declines, but from different baselines at different distance back in time.

We now have 14 post-Katrina polls for estimation. My analysis suggests an effect of Katrina of about -1%, once the negative trend since January and the effect of polling organization are taken into account. That estimate barely fails to reach statistical significance. The fact that 12 of the 14 post-Katrina polls fall below the simple trend line in the figure above, makes it clear that Katrina almost certainly has damaged President Bush's approval rating, but the effect does not appear especially large. The president has been losing .03% approval each DAY since January, in my model across all polling houses. That amounts to about 1% loss per month, or close to 8% since January. That the post-Katrina polls suggest a -1% impact amounts to an additional "month's" worth of lost support due to Katrina.

Tuesday, September 13, 2005

Bush Handling of Katrina, though Sept 12


Approval of President Bush's handling of hurricane Katrina situation, through September 12 polling. Posted by Picasa

Three new polls now suggest an improvement in the public's rating of President Bush's handing of the Hurricane Katrina situation. ABC/Washington Post, Gallup and SurveyUSA each show approval ratings over 42%, the best cluster of poll results for the President in several days.

The addition of these new polls produces a substantial uptick in the trend line of approval, shown in red in the graph above. However, this uptick may be an artifact of house effects. The two polls with comparable questions produce essentially no change.

The ABC/Washington Post result shows a slight decline in approval from 46% on 9/2 to 44% in the new poll taken 9/8-11. SurveyUSA poll, taken 9/12 holds steady at 42%, the same as on the previous SurveyUSA poll of 9/8

The Gallup result is for a different question than Gallup used in it's earlier survey of 9/5-6. In that earlier survey the question was "On a different topic: Do you think George W. Bush has done a great, good, neither good nor bad, bad, or terrible job in responding to the hurricane and subsequent flooding?" In the new survey, conducted 9/8-11 Gallup used it's more usual question: "Do you approve or disapprove of the way George W. Bush is handling the response to Hurricane Katrina?" Approval in the first survey ("great or good job") was only 35% compared to 43% in the new survey. However, the earlier question included a "neither good nor bad" category that drew 21% of the responses. So the conclusion is that the Gallup numbers are badly non-comparable, and no trend should be inferred from the two Gallup numbers alone. (If anyone knows of the more standard Gallup item on the earlier poll, please let me know. It wasn't in the original Gallup report.)

Monday, September 12, 2005

Bush Handling of Katrina, though Sept 9 (Corrected!)


Approval of President Bush's handling of the Katrina situation, through polls of September 9. The red line is an estimate of the trend in approval. Posted by Picasa

Two new polls on President Bush's handling of the aftermath of Hurricane Katrina suggest that opinion has held steady since September 5. The current estimate of the trend in opinion is that between 38% and 39% of the public approves of the President's performance.

This update adds two new polls, Time/SRBI (9/7-8) and Newsweek/PSRA (9/8-9). The Time poll registered a 33% approval while Newsweek found 37% approval.

The addition of these two polls, with two of the four lowest approvals recorded so far, reverses what appeared to be an improvement in evaluations of President Bush's handling of the Katrina situation. The AP/Ipsos poll of 9/6-8 found a 46% approval rating-- creating an overall upward trend in approval. (See the earlier graph here.) But with these two new polls, the red trend line is essentially flat since 9/5, with little sign of a real upturn.

The AP/Ipsos poll used a question wording somewhat different from other surveys, framing the question in terms of the "relief effort for the victims." MysteryPollster has a nice discussion of the possible impact of that question wording. In light of the more recent polls from Time/SRBI and Newsweek/PSRA, the AP/Ipsos question does look a bit higher.

Correction! In yesterday's post I relied on the Time Magazine website's description of the Time/SRBI survey. Rookie mistake on my part. The Time site described approval of President Bush as follows:

"President Bush Approval Rating: President Bush's overall approval rating has dropped to 42%, his lowest mark since taking office. And while 36% of respondents said they were satisfied with Bush's explanation of why the government was not able to provide relief to hurricane victims sooner, 57% said they were dissatisfied."

I used that 36% satisfied with Bush's explanation as a measure of approval of his job handing the hurricane situation, assuming incorrectly that this was Time's measure of Bush's handling of Katrina. But today SRBI has posted the full text of the survey, in which appears a standard job approval question, as well as the "satisfied with Bush's explanation" question. For the record the question texts and results are:

Q7. How would you rate the job that each of the following has done in responding to the hurricane and the destruction it caused? A. President Bush

Excellent/Good (net) 33%
Fair/Poor (net) 65%
Don't Know/NA 2%
Q9. How satisfied are you with the President's explanation of why the government was not able to provide relief to hurricane victims sooner?

Very/Somewhat Satisfied 36%
Somewhat/Very Dissatisfied 57%
No answer 7%

I've now replaced the Time/SBRI item in the graph with the correct data from Q7, which is similar to the question wording used by most surveys, rather than the less common question in Q9. The basic picture doesn't change, though the Time/SRBI Katrina job approval is even lower than I thought. The flat trend in approval since 9/5 is not affected by this.

I've also removed yesterday's original post. Not to hide mistakes (see above!) but to avoid having a misleading graph and comment on the site. No doubt this will be the last mistake I have to correct! <;-) (NOT too likely.)

Sunday, September 11, 2005

Post-Katrina Approval of President Bush (updated 9/11)


Bush job approval in all public polls taken since 1/20/2005. Red points are post-Katrina. The blue line is the trend in approval of President Bush since January 20, but before Katrina struck. Note there are two post-Katrina polls at 42% taken 1 day apart, so the two points are easily mistaken for one.Posted by Picasa

President Bush's approval ratings continued to decline in new polls taken towards the end of last week. The AP/Ipsos poll found an approval rating of 39% in interviews taken 9/6-8. Time/SRBI recorded a 42% approval over 9/7-8, while Newsweek/PSRA found a 38% approval level in its 9/8-9 survey.

In all three cases, the approval ratings are the lowest ever recorded for President Bush by the particular poll.

The direct impact of Hurricane Katrina, as opposed to the general downward trend in President Bush's approval, is not yet statistically precise. I estimate an effect of between -1.2% and -2.o% due to Katrina, after accounting for the general negative trend, and after accounting for differences between polling organizations. However, the number of post-Katrina polls is still not large enough to have great confidence in these estimates.

Saturday, September 10, 2005

Latest Bush-Katrina Approval


Update on approval of Bush's handling of Katrina. Posted by Picasa

The two latest poll results (through 9/8) suggest that approval of President Bush's handling of the Katrina aftermath has begun to rise. The AP-Ipsos poll, taken 9/6-8, shows approval of Bush's "handling the relief effort for victims of Hurricane Katrina" at 46%, with 52% disapproving. While not so good on balance, this is the highest approval of his handling of the relief effort since September 2. A SurveyUSA tracking poll of 1200 respondents taken on 9/8 found approval at 42%.

Interestingly, the AP/Ipsos poll found that the Presidents overall job approval fell to 39%, a new low for his presidency in the AP/Ipsos readings. More on that shortly.

Friday, September 09, 2005

Post-Katrina Overall Job Approval for President Bush


Post-Katrina Overall Job Approval for President Bush Posted by Picasa

An earlier post (here) presented data on public approval of President Bush's handling of the Hurricane Katrina situation. There the data show a clear decline in the President's rating over the past 9 days.

But what about his overall rating as president? The polling is only beginning to trickle in on that question, but here are the early returns. There have only been five post-Katrina readings of overall job approval. The first two, by CBS and Fox, completed interviews on 9/31, the first day after Katrina hit, so provide an important measure of initial reactions. CBS found a 41% approval rate, while Fox's was 45%. The three polls since then, by Pew, Zogby and CBS all finished interviewing on 9/7. Their approval numbers are 40, 40 and 42 respectively.

Both Zogby and Pew show significant drops, from 45% and 44% approval in their previous polls. However, those previous polls were taken way back in July. August was not a good month for the President's polls, so attributing all the decline to Katrina is a significant overstatement.

The CBS polls, taken 8/29-31 and 9/6-7, provide the best "before (well, early at least) and after" comparison. In this case, Bush's approval actually rises from 41 to 42%.

We can push the results a little more.

In the figure, I plot the 89 national polls taken since President Bush's second inauguration. It is clear that during this time, approval has fallen in a basically linear fashion, dropping at the same rate from January through August. There is also considerable variation across polls, much (though far from all!) due to differences between polling companies. So to estimate the effect of Katrina on approval, we should account both for the linear trend, and for "house" effects between different companies.

When we do that, the result is an estimate of -.52 for the post-Katrina effect, a decline of about a half a percentage point in approval. With the few polls and modest effect, this is far from statistically significant (p=.61).

The moral is that, if there is a decline in the president's overal job approval, it appears modest, though the data we have so far will support no firm conclusion of any change at all. No doubt there will be a flood of new data in the next week, providing more leverage for this estimate.

Thursday, September 08, 2005

Some historical perspective on Katrina

Some perspective on just how bad Hurricane Katrina is. These data are from the National Hurricane Center's list of deadliest and costliest hurricanes. I've included all hurricanes that caused at least 25 deaths OR were among the 30 costliest hurricanes (1851-2004). I've included storms since 1948 in the data, a total of 36 hurricanes.


Major hurricane deaths since 1948. Posted by Picasa

If the Katrina death toll is in the thousands, as has been suggested, then this will far exceed the worst storm of the last 50 years, Hurricane Audry which in 1957 killed 390 people. The Galveston, Texas, hurricane of 1900 killed between 8,000 and 12,000. An unnamed hurricane in 1928 killed between 2,500 and 3,000 in Florida. Nothing else in the last 100 years is close to 1,000 deaths. After some 30 years of declining death tolls, Katrina will establish a modern record for deaths.


Major hurricane costs since 1948. Posted by Picasa

Katrina is certain to become the costliest hurricane since 1851 in monetary losses. While the death toll has fallen over the past 50 years, the cost of hurricanes has trended up only modestly. The huge outlier is Hurricane Andrew from 1991 which cost over $40 billion (in 2004 dollars). Most recent major hurricanes have caused less than $10 billion (again, in 2004 dollars.) Of the five storms, besides Andrew, than have exceeded $10 billion, none have approached as much as $20B. While Andrew is an outlier that dwarfs all other storms, Katrina will certainly exceed Andrew by a substantial amount.

In historical perspective, Katrina is not just a major disaster. It is far greater than any hurricane of the past 50 years in both lives and gold.

Approval of President Bush's Handling of Katrina Situation


Trend in approval of President Bush's handling of Katrina situation. Posted by Picasa

President Bush has suffered from falling approval of his handling of the aftermath of Hurricane Katrina. Initially, support was as high as 54% on August 31. It has fallen subsequently as news coverage has presented the government's response in a consistently negative light. The President's trips to New Orleans and Mississippi, plus his assurances that the early performance was "not acceptable" and would be improved appear to have stopped the slide in his approval rating. Since September 4 the downward trend appears to have been replaced with a steady level of approval at about 38%, with some polls a bit higher and others a bit lower.

SurveyUSA has done daily tracking of reaction to Katrina. See MysteryPollster.com for an excellent discussion of the methodology used by SurveyUSA. (They use automated surveys, rather than human interviewers, a practice which most pollsters frown upon.) It is clear from the graph, however, that the SurveyUSA results are quite consistent with the polls by conventional polling organizations. Capturing the dynamics of opinion of President Bush is a particularly valuable contribution of the SurveyUSA polls.

As for the effect of Katrina on overall approval of the job President Bush is doing, stay tuned as more polls arrive.

Saturday, September 03, 2005

Presidential Approval in Perspective


Presidential Approval in Perspective-- All Gallup Polls since 1936Posted by Picasa

This graph represents every Gallup poll since 1936 that has asked presidential approval. (The first rating for FDR was taken 8/4-9/37. The question text is "Do you approve or disapprove of the way (president's name) is handling his job as president?"

This graph is designed to make comparisons across presidents clear. Time in office is scaled in the same way regardless of how long a president actually served. Failure to do this (which is common) distorts the trend lines by stretching out shorter term presidents while compressing those serving two full terms. By keeping the same scale for all presidents, the rate of change in approval is always comparable. Presidents who assumed office mid-way through their predecessor's term start their series at that point.

The vertical blue lines mark midterm and presidential elections, which are the natural "clocks" of politics.

Presidential Approval Update


President Bush Approval Rating in Gallup Poll Posted by Picasa

In the Gallup poll taken 8/22-25/05, President Bush hit the lowest approval of his administration, at 40% approval. In the immediate aftermath of Hurricane Katrina, the Gallup poll taken 8/28-30/05 his approval rebounded to 45% but this was taken before the extent of damage in Louisiana, Mississippi and Alabama was clear and before the difficulties of emergency response were known. Katrina made landfall in Florida on August 25. It struck Louisiana on August 29 at 6:10 AM local time. Thus the Gallup poll includes respondents from the 29th and 30th, after the Louisiana landfall, but also respondents from 8/28, before landfall. Gallup has not yet (as of 9/3) released a poll taken after the full scope of the disaster became clear.

Coming Soon.

This is a test post. Stay tuned for the real thing.