
The Canadian polls did a good job in estimating the vote for the January 23 election. The estimated vote was within a percentage point or so for the Conservative, BQ, NDP and Greens, and within about 3 points of the Liberal vote, which the polls underestimated. (Green results added, 13:00 CST)
The deviations between the polls and the actual vote are shown in the figure below.
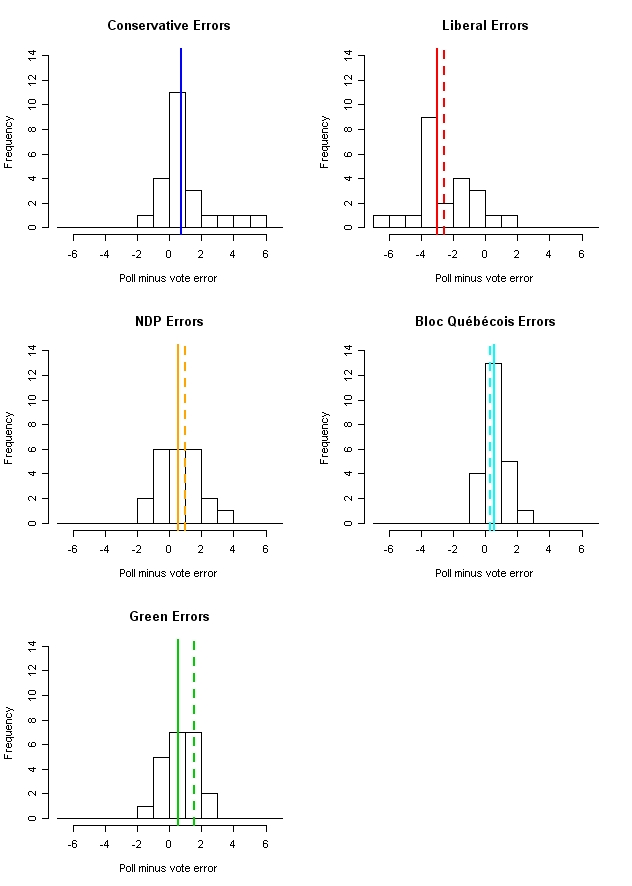
The figure plots the poll minus the vote. Positive errors mean the poll overestimated the vote, negative means the poll underestimated the vote. I use the 23 polls taken in the last week of the campaign, with interviews ending on or after January 15. From the trend figure above, it is clear that during this period there was very little trend in the last week which would complicate this measure of polling errors. In the error figure, the solid vertical line marks the median poll error while the dashed line marks the error of the final local regression estimate, plotted in the top figure. For the Conservative party, these two exactly overlap so only the solid line appears in the figure.
The median poll errors were Conservative +0.75, Liberal -3.02, NDP +0.51, BQ +0.52 and Green +0.51.
For the local regression estimate, the errors are Conservative +0.75, Liberal -2.42, NDP +0.88, BQ +0.27 and Green +1.33.
The local estimator was closer to the outcome than the median poll for the Liberals and BQ, the same for the Conservatives and further from the outcome for the NDP and Greens.
Only the Liberal vote was substantially underestimated, by -3% for the median poll and by -2.4% by the local estimator. Given the sampling error for most polls, this is a credible performance even with the Liberal vote.
The 5th, 25th, 75th and 95th percentiles for the poll errors are as follows:
Conservative: -0.43, 0.70, 1.75, 4.65
Liberal: -5.12, -3.22, -1.22, 0.68
NDP: -1.39, -0.49, 1.51, 2.47
BQ: -0.48, 0.52, 0.82, 1.52
Green: -0.49, 0.01, 1.51, 2.46
The second part of the story is the translation of votes into seats. Like all single-member district systems, Canada's electoral system tends to over-represent the largest parties and under-represent smaller parties in parliament. What is exceptional about Canada is a history of regional parties that win relatively small shares of the national vote, but win a larger share of seats based on strength within a single region. The Bloc Québécois is the current example of this phenomenon. The 2006 election results followed the historical pattern rather well.
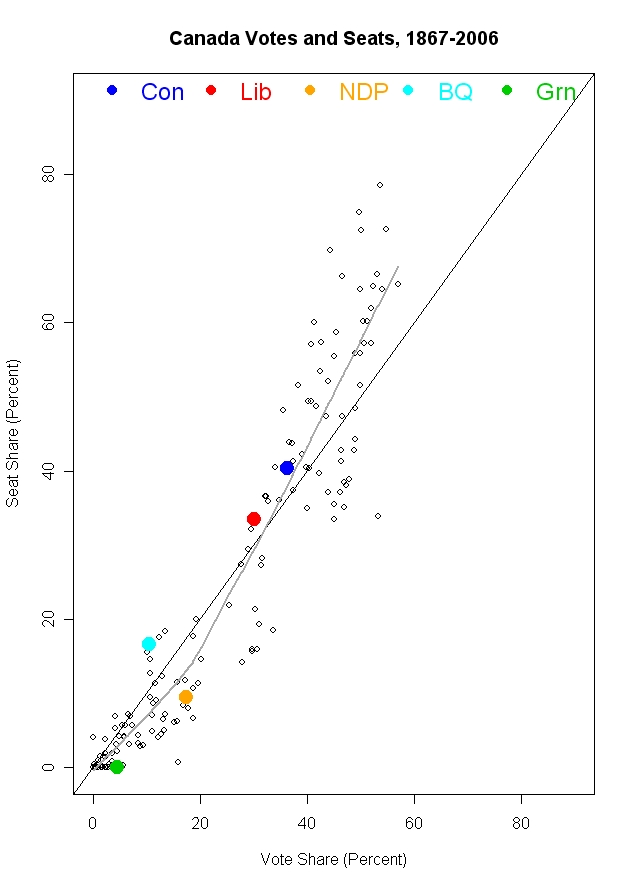
Votes and Seats in Canadian elections. The gray line is a local regression fit of past results as serves as an estimate of the seats we would expect given votes based on the history of outcomes since 1867.
The Conservative party seat share is very close to what history would predict based on their vote share. The Liberals did slightly better than the historical pattern, while the NDP fell slightly below the already disadvantaged seat share that the past predicts. The Greens show the typical fate of small parties with no regional strength: no seats despite 4.5% of the vote. The Bloc Québécois stands out as a clear example of the regional party advantage, doing better than expected based on national vote share alone, though in a cluster with previous outcomes for regional parties.
For more on the votes-seats relationship, see the discussion by Matthew Shugart at Fruits and Votes. Shugart is the expert on this topic. I'm just a dabbler in the votes and seats world.