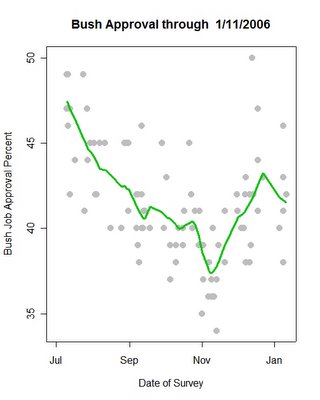
Approval of President Bush since July 1, 2005, with a local regression trend line.
My model of presidential approval discussed at length here (among numerous posts) is deliberately conservative in the sense that I don't want it to confound random noise or "blips" with significant trends. As a result, the model is designed to not respond very rapidly to short term changes. That is a virtue in general, since many analyses seize on a single polls and claim a trend (even if it logically requires at least two polls to make a trend.)
However, my approach has its defects, and the most important is that it will, precisely because it is conservative, be slow to spot new trends or changes in existing trends. So this post looks at a riskier approach-- one that is much less conservative, and hence more likely to be wrong and make mistakes, but also one that can spot a change without waiting a month.
The occassion for this is the new Fox poll which for the third poll in a row has approval of President Bush at 42% (since 11/30). With the four new polls from 1/8 and the earlier AP/Ipsos poll, we now have six polls from 2006 and so it seems I should take a closer look at the recent approval polling.
The result is the graph above. The fall decline was clearly reversed after November 11 and the climb appears unimpeded until just before the Christmas holidays (the last poll was 12/22). Between 12/22 and 1/5 there were no polls before the six starting 1/5. But the six recent polls fall mostly below the immediate pre-Chirstmas polling.
When the local regression trend is fit, the result is a clear downturn, with approval falling by 1.5%. from 43% to 41.5%. Thus there is a suggestion in the data that approval has not only slowed its rise (as I discussed here) but has actually started down again.
The caution is that this is not a conservative model. it is, in fact, one that is quite likely to be sensitive to data at the end points and in sparse regions of the data. The gap between 12/22-1/5 is unfortunate in this regard because it makes the estimation more unreliable. Hence this result should be seen as reflecting the current central tendency of the 6 polls taken since the new year began. As an estimate of trend, it is suggestive and perhaps right, but we won't have really sound statistical support for a claim that approval is once more moving lower until a lengthier sequence of polls are available.
Thanks to Robert Chung for pompting me to take this look at the data. He has a very nice display that shows that approval has at least slowed its rise here.