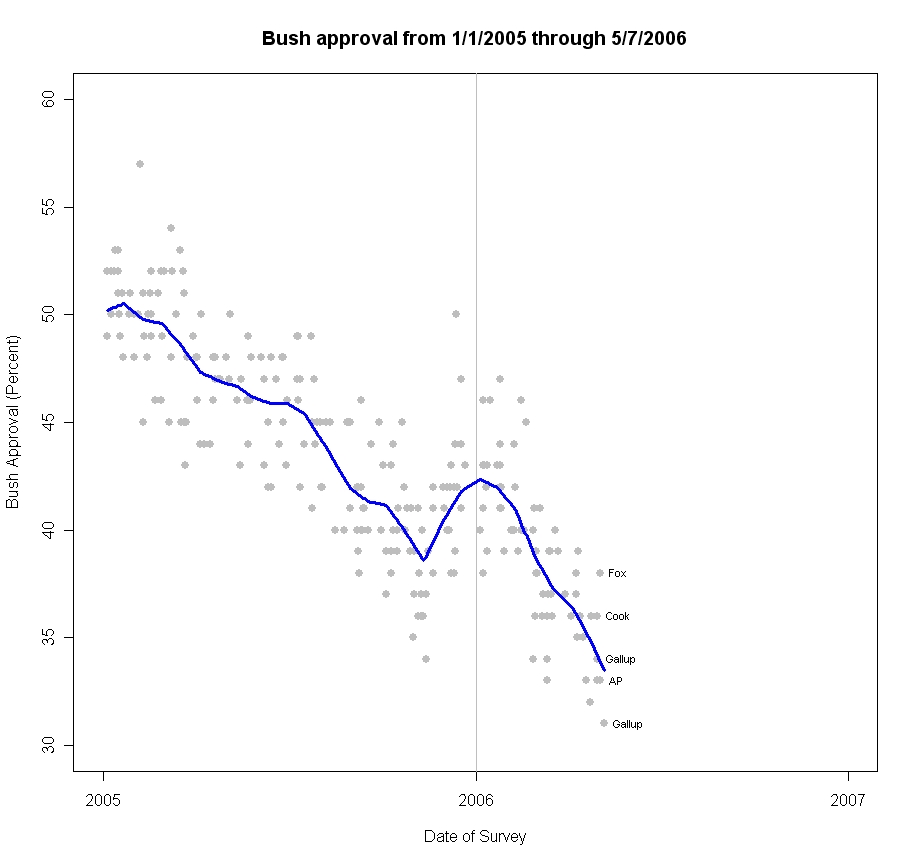
The new Gallup poll, completed 5/5-7/06 finds a surprisingly low 31% approval rating for President Bush, with a 65% disapproval rate. That is easily the lowest reading by Gallup, and a 3 percentage point decline from the previous 34% on 4/28-30, itself a "new low". The effect of this new Gallup poll is to pull my current trend estimate down to 33.5%.
While Dems will be thrilled, we might withold judgement about this rating for a few days. At 3% below the trend line, this Gallup result does NOT qualify as an outlier, but it is far enough away from the trend line that I want to see if others pick up a similar sharp drop in approval. All but Fox are down, but this rate of drop in Gallup, if true, would signal a sharp increase in the rate of decline-- a drop of 3% in one week, compared to my estimated trend which is declining at 1% every two weeks. Gallup was also quite close to the estimated trend in their 4/28-30 poll, 34% in the poll compared to 34.2% for the trend estimate. So the large change, and the movement away from expectations, makes me think this one may be a bit lower than the trend can justify.
This is essentially the mirror of the Fox poll at 38% discussed here. Fox was quite a bit high, and I expect their next result to be lower. Gallup is 3% below trend, while Fox was 4% above. Neither is unbelievable but both are far enough away that we might expect some movement back to the trend, down for Fox and up for Gallup.
What is shocking in Gallup, and which may be a sampling fluke rather than a new trend, is that Republican support has fallen to only 68%, a shocking drop from 81% in the 4/28-30 poll and the mid-70s or above since January (The average in 2006 has been 80.5%). If this is real, it marks the beginning of the end of President Bush's reliable "base." Conservative discontent was found in the recent AP poll, and Susan Page in USAToday reports the new Gallup poll finds 52% approval among conservatives, in line with the AP poll. That said, a drop of 13% points in one week is hard to completely accept. At the same time, Gallup found a 5% UPTURN among independents, from 21% to 26% approval.
We hear rumbling about conservative discontent, and I think it is possible that the dam that has held firm for so long may be about to burst. If so, the flood will drown many congressional Republicans while leaving the administration struggling to exert influence of any kind. But before Dems start celebrating, and before analysts rush to interpret this too strongly, we should wait to see if that 68% Republican approval holds in the next Gallup sampling. I'd bet it returns to the low to mid 70s, still a substantial and significant decline, but not a 13% drop. If I win that bet, the President is still in trouble, and if I lose it-- run for the hills-- here comes the flood.
With these latest moves in approval, and with the midterm elections of some interest, the following graph of approval since FDR is more relevant than usual. President Bush is still not the most unpopular post war president, and he hasn't tested the 20s in approval yet. And given trends since 2004, it is easy to exaggerate his difficulties. However, the graph makes clear how he compares with previous presidents at similar times before mid-term elections. Not so good.

(The light blue vertical lines mark elections, each 24 months.)
This graph, based on Gallup data freely available at the Roper Center here, is also regularly updated and available in the link at the top-right of every page here, as "Presidential Approval from Roosevelt to Bush in Historical Perspective". It is updated as new polling is completed.
Click here to go to Table of Contents