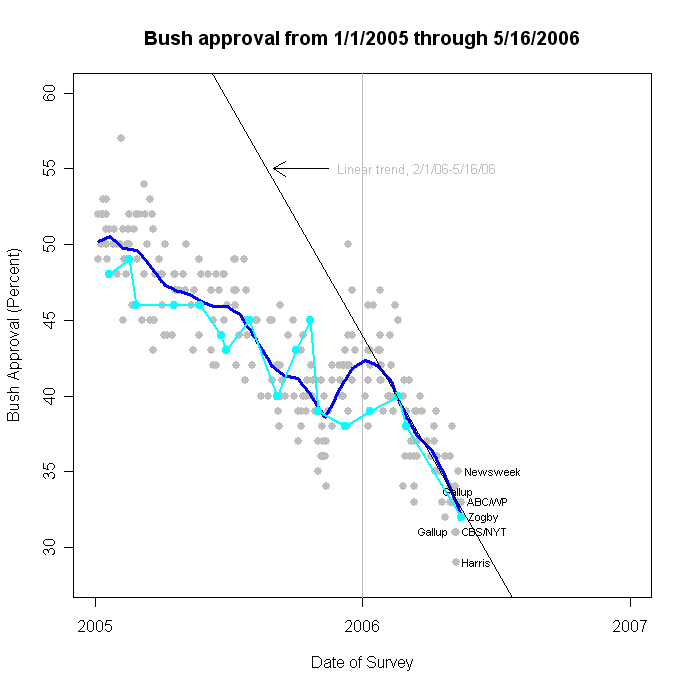
A new poll from Zogby (5/12-16/06) finds approval of President Bush at 32%, disapproval at 68%. With the addition of this poll, my trend estimate now stands at 32.05%, continuing down from 32.2% as of polling through 5/15.
There has been little variation in the rate of approval decline since the State of the Union address on January 31. Over the period from 2/1/06-5/16/06 the rate of decline has been -.074% per day, or one percentage point each 13.5 days. As of the first of May that estimate was slightly lower, one percentage point each 13.9 days. This is NOT a statistically significant difference, but remains a perilous rate of decline for the White House. No news there. Still no sign of a lower limit (though I don't think we are close even if there is such a thing.)
Despite the recent Harris poll at 29% approval, at this rate it will be June 13 before the trend estimate reaches 30% approval. I keep waiting for this rate to change. The President's Monday night address on immigration is not yet a significant factor in the polling. CNN's snap poll found 40% of speech viewers responded "very positively" and another 39% "somewhat positively". But this is a highly self-selected sample of viewers of the President's address. MysteryPollster has written convincingly on the bias inherent in such polls (see his related pieces too) and I think their results are highly suspect if extrapolated to the population of adults. So let's see some new national samples of post-speech respondents to estimate any impact of the address. Given the elite fury this week, I doubt we'll see a "win". If there was a window for presidential leadership on this issue it appears to have closed. (And I thought there WAS such a window a few months ago.)
Zogby uses a four point approval question:
“Overall, how would you rate President Bush's performance on the job? Excellent, Good, Fair, or Poor?”This is similar to Harris' four point phrasing, but not quite the same. Harris' is
"How would you rate the overall job President George W. Bush is doing as president: excellent, pretty good, only fair, or poor?"What is the difference between "good" and "pretty good" and between "fair" and "only fair"? In my post on Harris' 29% approval poll, I speculated that "only fair" might be attractive to disillusioned former Bush supporters, partially accounting for the low 29% approval rate. The Zogby poll is 3% above that reading, with a similar if not identical "fair" option. The difference is within the margin of error, but not entirely consistent with my speculation, which would have predicted Zogby to be clearly below trend, which it is not.
Click here to go to Table of Contents