Showing posts with label ivr. Show all posts

Thursday, September 07, 2006

Hot House Races Lean Dem


RT Strategies and Constituent Dynamics have produced a very interesting look at 30 competitive House races. See their results at their web site here. What sets their polling apart from most others is that these are samples of about 1,000 respondents within each congressional district. Further, the vote question uses the names of the candidates, not a "generic vote" format that asks only if you would vote for the unnamed "Democratic or Republican" candidate. (RT/CD DID use the generic form in the districts that have not yet held contested primaries. There are seven of those in their sample, which I have excluded from my analysis. In addition, interviewing is not yet complete in three districts. So my analysis is based on the 20 districts with named candidates and completed interviews.)

The graph above shows the distribution of the polls, using the margin between Dem and Rep, with the 95% confidence interval shown. Where the margin is greater than 2 standard errors from zero, I've colored the dot dark red or blue; where the margin is between 1 and 2 standard errors from zero I've colored it light red or blue, and where the margin is less than one standard error I've given it just a slight tint.

A glance at the figure shows the Dem ahead in 13 races and the Rep ahead in 7. The Rep has a statistically significant lead in 5 races and the Dem in 6. Of those too close for statistical significance, the Dem has an edge in two and the Rep in none. Of the true tossups, the Dem is "leading" (by a statistisical phantom!) in 5 and the Rep in 2.

But, these races are overwhelmingly in Republican districts, and there lies the really interesting story. Of these 20 seats, 16 are currently held by Republicans, and 13 have a Republican incumbent seeking reelection. Given the usual incumbency advantage, we should expect these seats to be going overwhelmingly for the Republicans, yet they are not.

Of the16 currently Republican districts, seven are leaning Rep, while 9 are leaning Dem. Yet of that 9, only 3 are clearly (i.e. by a statistically significant margin) favoring the Democrat. Two are possibly favoring the Dem, and four(!) are way too close to call though with the Dem ahead by a point or three. Still, to even break even in seats held by the opposition is quite a remarkable acheivement by an out-party. Leading (even if only by a ghost) by 9 to 7 is remarkable.

Of the four seats currently held by Dems, three seem secure, with Dems holding a statistically significant lead. In one case, IL-08, the polling shows a very slight Dem lead.

If we threw caution to the wind and ignored the confidence intervals, we'd see the potential for a net gain of 9 seats for the Democrats out of this group of 20 districts, or over half what the Dems need to retake the House. If we prefer a bit of caution, we'd see a likely gain of 4-5 seats with 7 way too close to call. And if we were good conservative statisticians, we'd say (maybe!) a gain of 3, with 9 seats too close for a statistically significant lead by either party.

Some caution is needed in interpreting these results. The polling was done by "interactive voice response" interviewing, that is a recorded voice asks the questions. This produces very low response rates, though usually from a good sample of telephone numbers. In this case, the survey also used listed numbers only. That is required in order to be sure which congressional district a respondent lives in. But it costs the loss of all unlisted numbers, which can be significant especially in urban areas. This is a common tradeoff in sampling congressional districts, but deserves some caution.

Finally, some other reports based on these data have included the 7 races that did not name both candidates but used "the Democratic/Republican candidate." There is excellent reason to think that this "generic ballot" format overstates the vote for Democrats, so I have excluded those races from my analysis. I think including these races significantly overstates the number of seats the Dems are likely to win. (See, for example, WI-08.)

This is a great study, even taking the cautions into effect. I hope we'll see more!

The races included in this group of 20, and the 95% confidence interval is listed in the table below.


The "margin" is Dem minus Rep percent in the table above.


Click here to go to Table of Contents

Friday, August 18, 2006

WI Gov: New polls, same story


UPDATE 8/21: Rasmussen has a new poll showing Doyle at 49, Green at 41. Blogger is refusing to upload my new graphs, but as soon as it feels better I'll update the graphs here as well. Graphs are now updated.

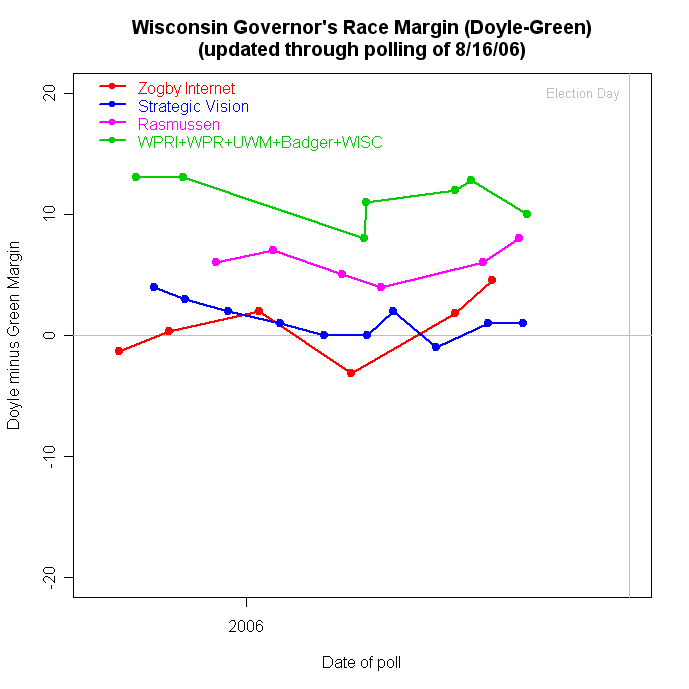
Two new polls out on the Wisconsin Governor's race tell much the same old conflicting story. (See here and here for previous tellings of this tale.) A WISC-TV/Research2000 poll conducted 8/14-16/06 found incumbent Democrat Jim Doyle with a 48%-38% lead over Republican challenger Mark Green. Green is the incumbent member of the U.S. House from the 8th Congressional district (Green Bay.) But a Strategic Vision survey conducted 8/11-13/06 found a miniscule Doyle lead, 45%-44%. The Strategic Vision poll is exactly in line with their past polling showing the race as a virtual dead heat, with a very slight Doyle advantage. The WISC/Research 2000 poll is in line with other statewide polling that has consistently found a substantial Doyle lead, but which has also shown a slow but steady rise in Green's support. The problem, of course, is which poll to believe, or at least how to understand why they are different.

The top figure shows the trends for Mark Green with Doyle's support as the gray dots. Doyle's polling is quite consistent across all the polls, with support in the mid-to-upper 40s but consistently falling short of the 50% point. Green on the other hand varies widely across polls, with a slow upward trend for the "green" line polls but largely flat (though higher) in the other organizations' polling.

An alternative look is given in the graph below, which plots the margin between Doyle and Green in each poll. Strategic Vision and Zogby's Internet based polls find little or no trend, while Rasmussen's "Robo-poll" finds a larger margin, but also no trend. The other polls find a small downward trend and a larger Doyle lead.


(Graph updated 8/21 with new Rasmussen poll.)

So why the differences? One reasonable theory now seems less plausible. The "green line" polls from WPRI, WPR, UWM and Badger were samples of adults rather than "likely voters". That made for a nice story-- adult samples include more people who are less interested in politics and therefore know the least about any challenger. The result would be lower support for the lesser known candidate. In contrast Strategic Vision samples "likely voters" whose greater interest and involvement would increase their knowledge of the challenger, making him appear more competitive in their samples.

The problem is that the new WISC/Research2000 poll is also of "likely voters", so the 10 point gap there can't be explained as due to the sample population vs the population producing the 1 point gap in Strategic Vision. Now all firms differ in how they select "likely voters", and they rarely explain their methods (often they are considered proprietary) so there may still be some difference in method here. Still, this is a large and persistent gap.

A further complication is the fact that WISC/Research2000 DOES line up with the previous samples of adults. Why doesn't the more selective likely voter sample produce at least some advantage for Mark Green? (Any comparison across survey organizations is fraught with peril since they differ in many ways. Still we'd expect a systematic difference between adults and likely voters to stand out more.) If we must strain for some explanation of this, one possibility is that the campaign remains low key enough that even likely voters have not yet started paying attention. Us junkies are certainly attending to every word, and streaming the commercials as soon as they come up on the candidates' websites, but "normal" people may still not be that aware of the campaign, even among those regular voters who are captured in the "likely" voter sample. (Of course there is a good deal of post-hoc rationalization there, when the obvious prediction should be that Mark Green does better in LV rather than Adult samples, so make of this story what you will.)

If we accept for the moment that the issue is NOT the sample population, then what might account for the Strategic Vision difference? Democrats have been critical of the Strategic Vision surveys, pointing out that Strategic Vision is a Republican firm that does these statewide "free" surveys as a marketing tool. But I think Democrats are wrong to claim that Strategic Vision is a "bad" pollster. I tracked 1486 statewide polls of the 2004 presidential race, of which Strategic Vision did 196. The Strategic Vision polls average error overstated the Bush margin by 1.2%. The 1290 non-Strategic Vision polls overstated KERRY's margin by 1.3%. Further, the variability of the errors was a bit smaller for Strategic Vision than for all the other polls combined. (That is a little unfair to the other pollsters because it mixes many organizations while comparing to a single survey "house." Since pollsters differ, that increases the variation due to pollster in the 1290 non-Strategic Vision polls.) So the bottom line is that Strategic Vision does not appear, based on their track record in 2004, to be noticably biased compared to others. And they did err in the correct direction of the winner in 2004, while others erred in the direction of the loser.

So what else might explain the differences here? One possibility is the order of the questionnaires. WISC/Research2000 appears to have asked Doyle Job, Doyle and Green favorability and then vote. getting right to the point. In contrast, the Strategic Vision polls have always opened with a lengthy battery of national questions. In the most recent poll they have 11 questions before asking Doyle job approval, legislature job approval and then vote. The 11 opening questions include Bush job overall, on the economy, war, terror and immigration, whether Bush is a "Reagan conservative", amnesty for illegals, building a wall on the border, whether Roe v. Wade should be overturned, whether we should withdraw from Iraq within 6 months, and whether there will be a terrorist attack in the next six months! That's a LOT to think about before getting to the Governor's questions. While they mostly don't deal with state politics, this series seems likely to raise people's partisan and ideological awareness and might well then structure responses more along partisan lines. That could raise Green's votes among Republicans who aren't yet paying attention, but whose Republican loyalties have been activated by the opening 11 questions. In contrast, the WISC poll with little introduction would do less to get people thinking along partisan lines.

Since Strategic Vision always has had this lengthy opening section prior to the state race questions we can't know if the order of questions really produces this effect or not. (If they'd randomize the order for us once we could find out!) But since the sample population doesn't seem to be the key variable, survey question order is the next most likely suspect.

It is great to see WISC sponsoring Research2000 polling. That brings a new and independent pollster to the table, which provides crucial information about why the polls differ. At least now we know it isn't simply the adult vs likely voter difference in the samples.


Click here to go to Table of Contents