Showing posts with label house06. Show all posts

Thursday, February 01, 2007

Party ID in States Shifted in 2006


Democrats gained an average of 3.4% and Republicans lost 3.0% in partisan identification between 2005 and 2006, according to a new Gallup estimate based on over 30,000 interviews conducted throughout 2006. Gallup aggregated polls throughout the year to create estimates of party identification at the state level, as they did in 2005 and previous years. Gallup's report of the results is here.

The plot above shows how uniform the shift in Democratic and Republican partisanship was across the states. The colors of the points reflect the Democratic minus Republican balance in 2005-- the darker the blue the more net-Democratic identifiers and the darker the red the more net-Republican identifiers. Light or pale points are closely balanced states, as of 2005. The size of the points is proportional to the size of the state.

There is no apparent pattern to the shifts in partisanship: regardless of partisanship or partisan balance in 2005, states shifted by about the same amount in 2006. Likewise, Republican losses shifted uniformly. The +3.4 percentage point shift for the Democrats, and the -3.0 point shift against the Republicans produced a net -6.4 point loss for the Republicans in the balance of partisanship. The lower left figure in the plot shows that independents shifted more or less randomly between 2005 and 2006.

These shifts could, in principle, represent a non-trivial gain for the Democratic party. Recall that after the 2004 election there was considerable talk in Republican circles of establishing an "enduring Republican majority", a goal that seemed within the party's grasp though certainly not assured. That hope is clearly out of reach at the moment.

Before Democrats go wild with joy, there remains a question about the electoral impact of these partisan shifts. Party identification is the strongest single predictor of vote choice at the individual level. But the shifts in partisanship in the Gallup data do not predict the shift in voting for the U.S. House in 2006.

The bottom right figure above shows that the Republican U.S. House vote shifted more or less uniformly across states as well. However, when we look at the relationship between party id shift and vote shift across states, there is no relationship at all, as seen in the figure below.


Controlling for both Democratic gains and Republican losses doesn't add to the relationship. So the conclusion here is that both partisanship and vote shifted against the Republican party in 2006, but the variation in shifts appears to have been essentially independent between partisanship and vote.

Democratic gains and Republican losses in partisanship may affect the 2008 prospects in the House (and other) elections. But in 2006, it appears both vote and partisanship responded to conditions in the country without a clear impact of changes in partisanship on changes in vote.

Tuesday, November 21, 2006

Ideology and Republican Losses


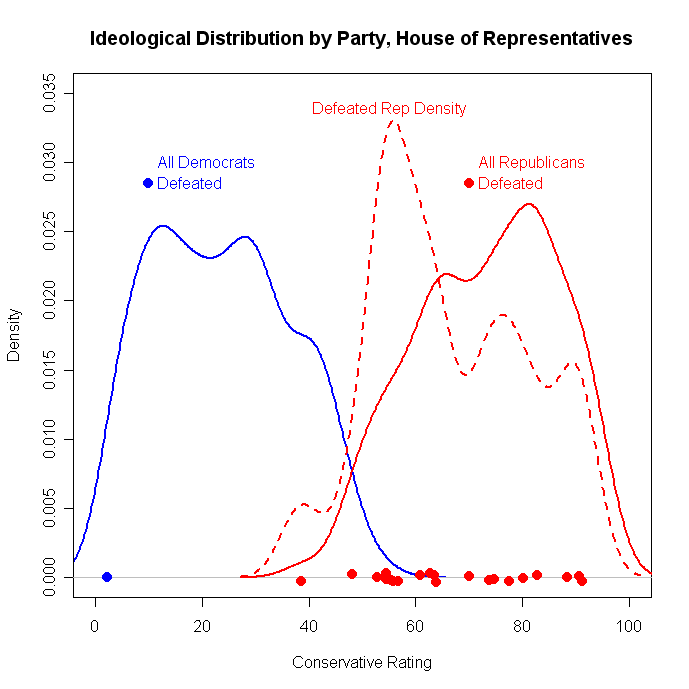
Republican losses fell along most of the ideological spectrum, but were a bit more common among moderates than among the more conservative members of the party. The graph above shows the distribution of conservatism in the House of Representatives by party, using the National Journal ratings. (I use National Journal because it is convenient to grab the data, includes more votes than the typical interest group rating and correlates highly with other (more "political science-y") measures such as Nominate scores. Nominate scores are not yet available for the 109th Congress and I don't have time to compute them myself right now. Readers interested in how Nominate scores are computed should see Keith Poole's excellent site here.)

Republican incumbents who were defeated for reelection had an average conservatism score of 66.5, while those who won averaged 74.3, a statistically significant difference. (The average for all Republicans in 2005 was 73.2, and the median was 74.4.)

This does not mean that Republicans were necessarily more vulnerable BECAUSE they were more moderate. What is left out here is the district. Moderate Republicans are more likely to come from less conservative districts, so this result may well simply reflect the more competitive nature of districts that produce more moderate Republican members. I'll take a look at that later, but for now the simple point is that the election defeat did fall more heavily among representatives with somewhat more moderate voting records.

The one Democratic defeat plotted here is Rep. Cynthia McKinney, GA-04 who lost in the primary. The plot above also includes Republican Rep. Joe Schwartz, MI-07, who also lost in a primary.

Sunday, November 05, 2006

Dem wave crested; advantage shrinks


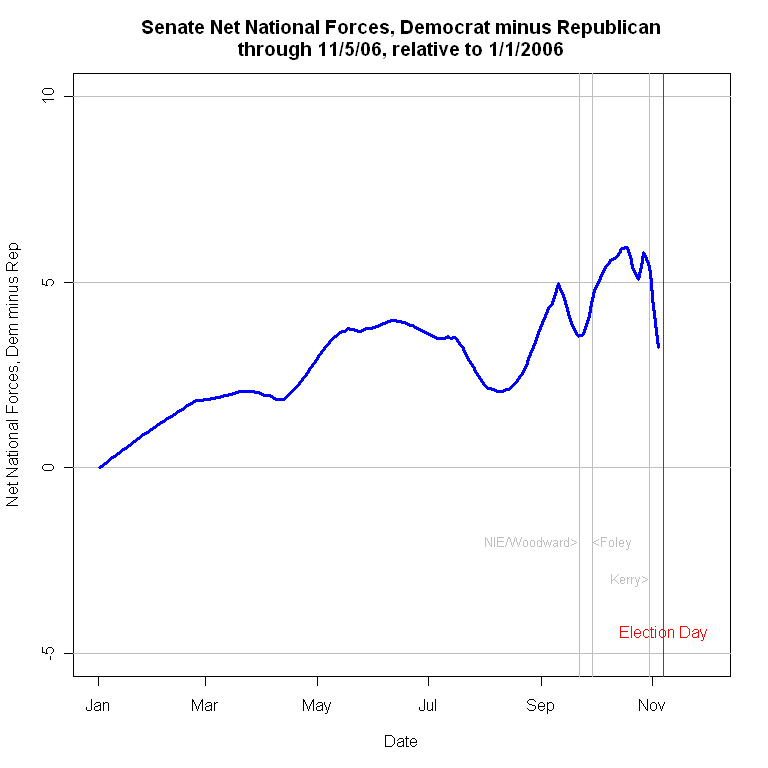
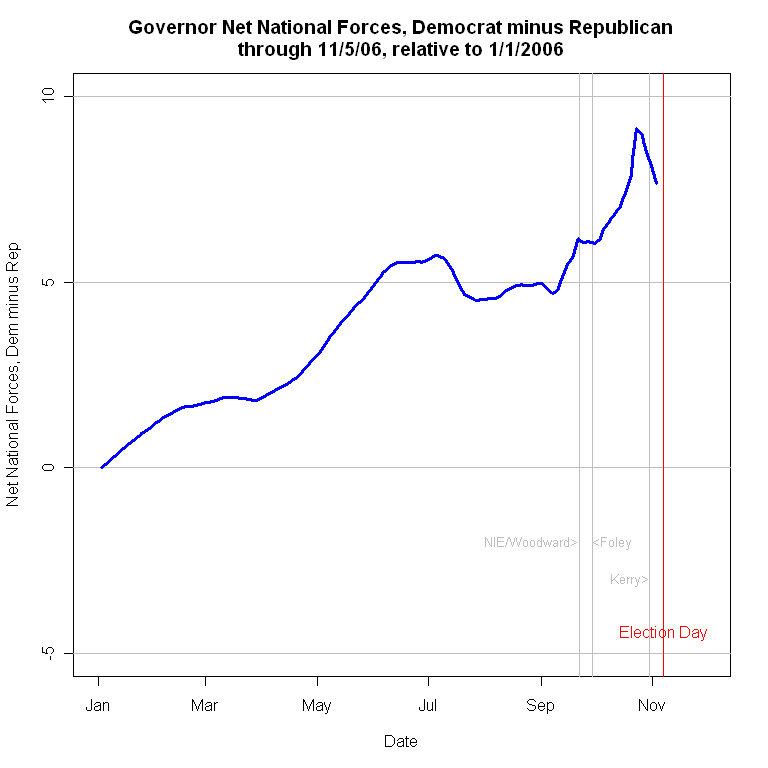
Across the board, in Senate, House and Governor's races, the wave boosting the Democrats crested about 10 days ago. Since then the advantage Democrats have built throughout the year has been reduced by from 1.5 to 3.5 percentage points. While forces are still a net positive to the Democrats, these forces are weaker than they were during the week before Halloween. This implies that the most competitive races will now be harder for Democrats to win and easier for Republicans to hold. This implies that the anticipation of a major surge to Democrats now needs to be reconsidered. While race-by-race estimates still show an 18 seat Democratic gain, and 27 seats as tossups (see our scorecard at Pollster.com here), this reduction in national forces makes it less likely the Democrats sweep the large majority of the tossup seats and could result in total gains in the 20s rather than the 30s or even 40s that looked plausible 10 days ago.

This cresting of national forces has taken place across Senate, House AND Governors races and occurred essentially simultaneously around October 25th. The estimators here, plotted as the blue line in the figures, is a measure of national effects that are common across all races. The estimate uses all polls in all races, but estimates the Senate, House and Governors races independently, yet produce similar results for each in terms of timing, though with some variation in magnitude. (For more on the estimation method, see this earlier post.)


As of last Thursday's data, the downturn was clear for the Senate but no indication of change had appeared for the House. Adding the polling data from Friday, Saturday and Sunday, the downturn is now apparent there as well. I did not do the Governors last week.


The congressional generic ballot does NOT show any such change (yet!). In my earlier post I cautioned that the generic ballot might not be reflecting a realistic assessment of the Democratic advantage. It may also not be reflecting the last minute dynamics of the campaign this year.


So what does this mean? The House still looks likely to go Democratic, but probably by a smaller margin that it might have a week ago. For a while, the Senate looked to come down to who won two of VA, TN and MO. Now MT must be added to that, and TN moved to lean Rep, perhaps requiring a Dem sweep of VA, MO and MT. (Momentum in VA remains pro-Dem, while MO is completely flat and MT is strongly trending Rep.) Possible but more of a trick that 2 of the former 3 states. The shrinking margin in MD may well end with a Dem win, but clearly some races that were viewed as likely Dem pickups or holds are now somewhat more in doubt that before, possibly including RI.

With two days to go there is a time limit on this dynamic. Reps may not have time to profit greatly from this trend, and we've seen sharp changes before so Dems may be able to recover (Republicans had a bad end of the week last week, after John Kerry and the Dems had a bad first of the week.) So no firm prediction here, but the evidence is that the Dems are falling back from their best chance of large gains.

Click here to go to Table of Contents

Friday, November 03, 2006

House 06: National forces estimate


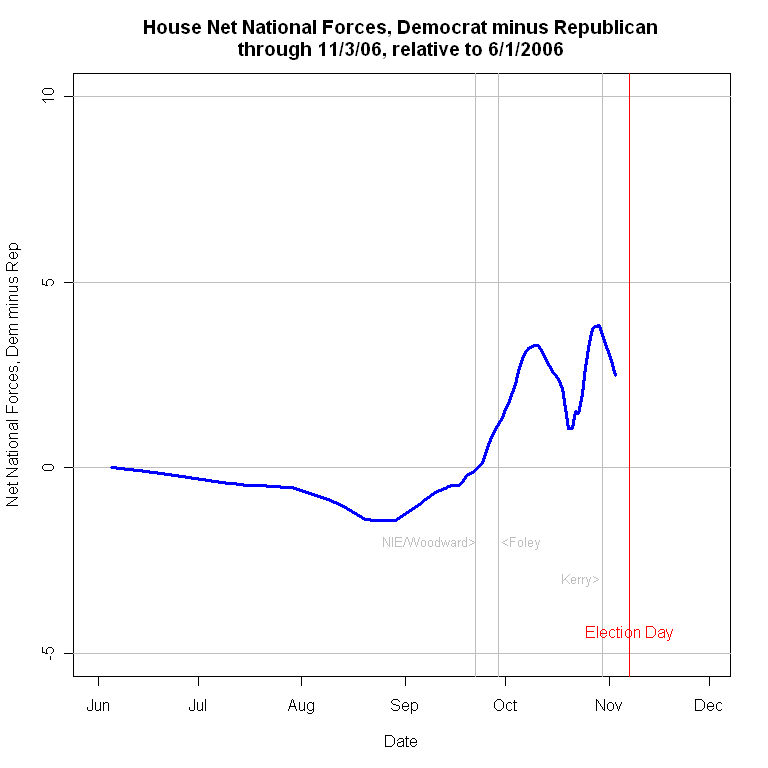
I estimated the net national forces in the Senate rate last night. Here is the same estimation procedure applied to the House. This is based on 86 House races with a total of 380 polls. This is much less dense than the Senate data, but the results are surprisingly stable. Unlike the Senate, however, the data do not extend back in time very far, so the starting point here is June 1, 2006. The size of the effects here are also NOT comparable to the Senate forces, since both are estimated independently and the zero point is arbitrary in both cases. Relative movement is meaningful, so it is fine to say that since June 1 the net national forces in the House (for these 86 races) have risen about 6 percentage points.

As with the Senate, this is a good explanation for why so many House seats held by Republicans are now competitive. UNLIKE the Senate, these effects appear to have continued to grow recently. Even a much rougher fit still produces the upward rise at the end. This also is consistent with the growth in the Democratic advantage on the generic ballot, though the details of the dynamics are somewhat different.

The evidence then is favorable to larger than anticipated Democratic gains in the House, but smaller gains in the Senate, at least as of November 3. Four days to go.


Click here to go to Table of Contents

House 06: Generic Ballot


The generic ballot measure of the House has surged up and not stopped rising since September 22. The surge began the week in which the National Intelligence Estimate (NIE) appeared, followed by Bob Woodward's book, State of Denial. A week later the Foley scandal broke, adding to the move that began a week earlier.

The week or so before the NIE was published there was a small trend in the Republican direction which was remarked on in political news, but this very modest movement was abruptly revered. I would not have thought the NIE or Woodward revelations would have had much effect on mass public opinion, but the timing here is pretty convincing that these did in fact play a role. I speculate that was due to undermining the growth in approval of the administration on terrorism which built in late August and early September, though convincing data of this link is missing. Certainly no such inference is needed with regard to the impact of the subsequent Foley scandal.

The generic ballot is, of course, only a rough indicator of election outcomes (see here, but also see the forecasting efforts of Bafumi, Erikson and Wlezien here and Alan Abramowitz here). I also think the current upturn is a political equivalent of "irrational exuberance" in the sense that the run up in the polls seems likely to seriously overstate the actual vote margin. The current 17 point Democratic margin would be enormous, and even applying the "Charlie Cook Correction" of subtracting 5 points would still imply a 56-44 Democratic triumph. It may happen, but the generic ballot has virtually always overstated the Democratic lead, and this overstatement seems to get worst as the polling margin increases.

For a bit of perspective, the figure below plots the generic ballot since 1994. The conclusion is clear-- the poll measure has not been anywhere near current levels in the past 12 years. The practical result of this remains to be seen, but if Democrats fail to capitalize on this opinion advantage there will be some interesting research to understand why the seat gains fail to respond to this advantage in vote intent (well, in generic vote intent, which isn't the same thing.)


Click here to go to Table of Contents

Tuesday, October 10, 2006

Generic Ballot: Dem Lead Widens Post Foley


The post-Foley Folly polls find an upturn in the Democratic margin in the generic Congressional ballot. Prior to the Foley developments, Democrats held a 10.6 point lead in the polls. (This is the Dem percent minus the Rep percent.) That lead has now jumped to 12.8 points, the highest my trend estimate has reached in the 244 generic ballot polls taken this election cycle. This is all the more important because prior to the Foley Fiasco the trend had moved a bit down, then flattened (though still at or about 10.6, a very strong margin even then.) Whatever possible gains Republicans were beginning to make have now been wiped out.

One important concern is that CNN and Gallup produce extraordinarily high values on the generic ballot in this poll. (Remember, these are now down independently-- CNN uses Opinion Research Corporation for it's polling, while Gallup now polls for USAToday only since the dissolution of the old CNN/USAToday/Gallup partnership.) These values of over 20 points are simply implausible given the rest of the data over the past two years, and the other data from the past two weeks. Could it be that my trend estimate is being unduly influenced by these two absurd results?

No. If I exclude the latest CNN/ORC and Gallup/USAToday polls, the trend estimate is a Democratic advantage of +12.4 points, rather than the 12.8 points if these two are included. That small change in trend would still be the highest Democratic margin of the past two years, and when plotted the line without these polls is visually all but indistinguishable from the blue trend line in the figure.

And so we are back to the key question: how much will this huge (compared to elections since 1994) Democratic lead translate into seats? Will we see movement in polls for individual House races move as well? Stay tuned.


Click here to go to Table of Contents

Friday, October 06, 2006

Generic Ballot: Decline ends, upturn??


I'm between planes so no time for a full post, but the generic ballot that was trending slightly down two weeks ago is now at least flat and perhaps very slightly rising. Too soon to tell what the real effect of the Foley affair will be, but certainly the trend has shifted from down to flat. I'll post more at the next delayed flight (which could be soon.)


Click here to go to Table of Contents

Thursday, September 28, 2006

Generic Ballot: Three polls slightly below trend


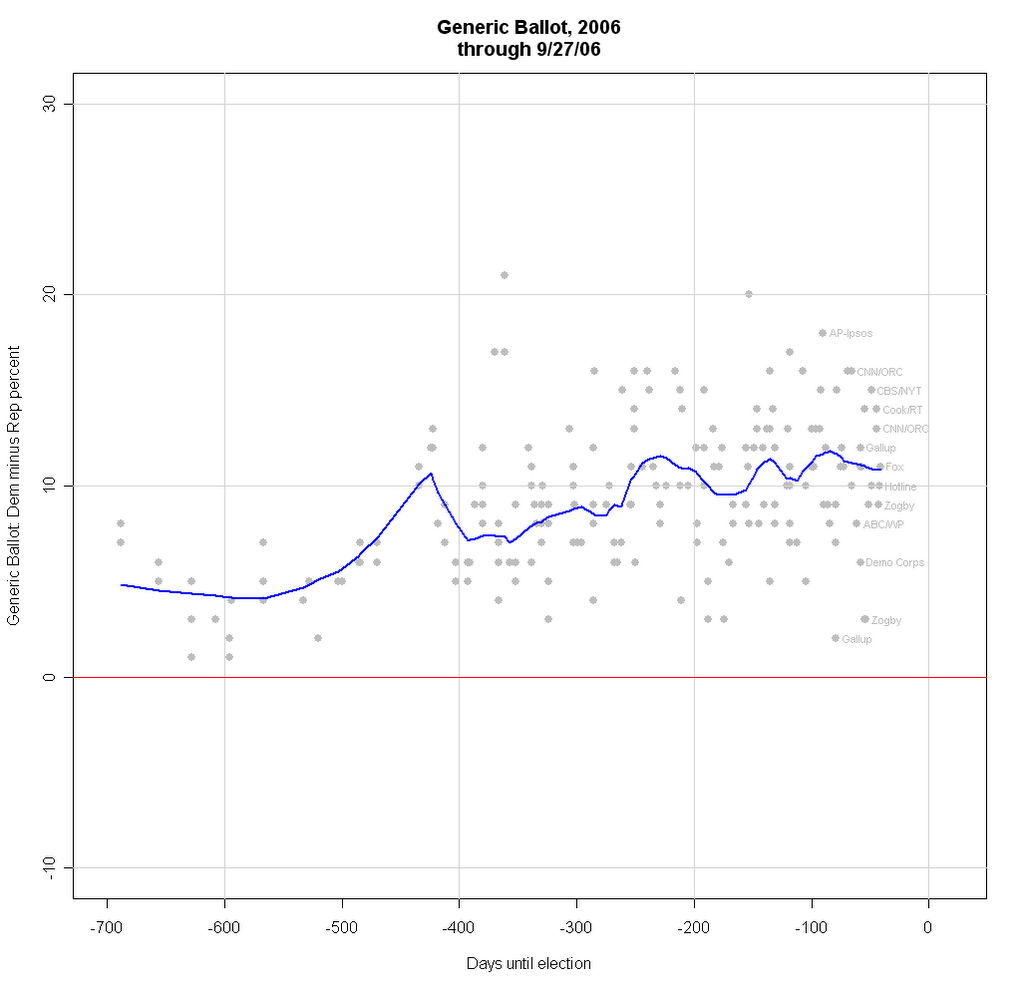
Three new polls put the Democratic margin over Republicans in the generic ballot House vote at +10, +11 and +9. Those are slightly below the previous trend estimate of +11.4, and with these new polls added, the trend estimate now stands at +10.8. This still leaves a relatively flat trend following about a 1 point decline in the Dem margin. As I wrote here yesterday, the surge in support for President Bush (to 42.2% today, see here), appears not to be driving the generic ballot, at least not yet. The trend estimate has remained between +10 and +12 for the last 150 days or so, though with some small cyclical movement.


Click here to go to Table of Contents

Wednesday, September 27, 2006

Generic Ballot: After a dip, stable


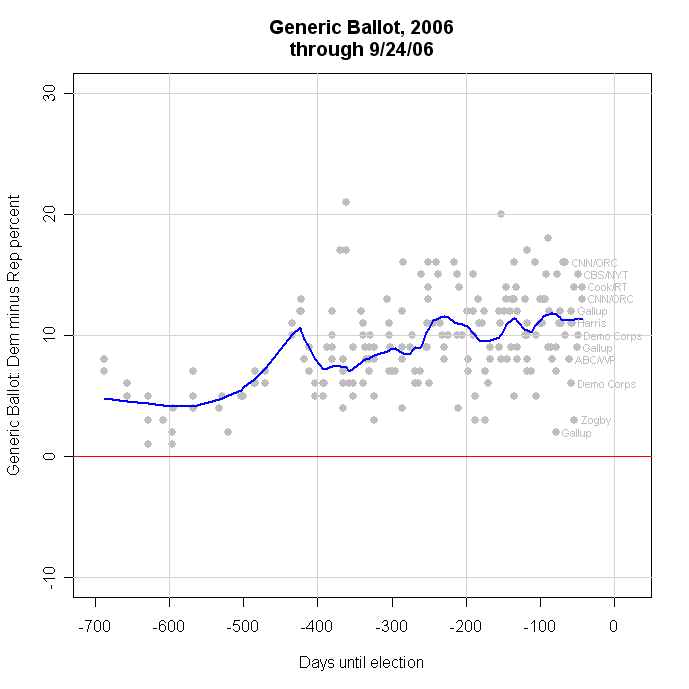
After a flurry of polls indicated a dip last week, the generic ballot for the House now appears to have stabilized. Last week the Democratic lead (that is, Dem% minus Rep%) fell from +12 to +10. New polling however suggests that the dip was less and now estimates the Democratic lead at +11.4%. More important, the upturn in Bush approval rating that remains quite strong now appears not to be driving the generic ballot, as it seemed to be doing last week. (See the latest approval trend here.) With the new data, the dip appears mild and the trend is now flat. This is not out of line with Senate polls which have so far failed to show a move in the Republican direction over the past couple of weeks.

The range of values on the generic ballot is striking. While all polling is variable, it is clear from the polls indicated in the right of the figure, that this question produces a strikingly large range of results. In part this is a simple artifact of the measure being the LEAD of Dems over Reps. The variability of a difference is larger than the variability of either of its components. So if the margin of error for the Dems and for the Reps is 3%, the margin of error for the difference is close to 6%. Even so, readers would be well advised to be wary of highly variable polling on the generic ballot. A lot of attention is being paid to this measure which is certain to vary a lot from poll to poll. Simply looking at the latest poll compared to the previous is likely to vastly overstate amount of change that is taking place. That variability also means it is hard to know precisely where the measure stands, based on individual polls. The trend (blue line in the figure) is the best estimate. And remember, translating the generic vote margin into seats is also an uncertain business. See here.


Click here to go to Table of Contents

Thursday, September 07, 2006

Hot House Races Lean Dem


RT Strategies and Constituent Dynamics have produced a very interesting look at 30 competitive House races. See their results at their web site here. What sets their polling apart from most others is that these are samples of about 1,000 respondents within each congressional district. Further, the vote question uses the names of the candidates, not a "generic vote" format that asks only if you would vote for the unnamed "Democratic or Republican" candidate. (RT/CD DID use the generic form in the districts that have not yet held contested primaries. There are seven of those in their sample, which I have excluded from my analysis. In addition, interviewing is not yet complete in three districts. So my analysis is based on the 20 districts with named candidates and completed interviews.)

The graph above shows the distribution of the polls, using the margin between Dem and Rep, with the 95% confidence interval shown. Where the margin is greater than 2 standard errors from zero, I've colored the dot dark red or blue; where the margin is between 1 and 2 standard errors from zero I've colored it light red or blue, and where the margin is less than one standard error I've given it just a slight tint.

A glance at the figure shows the Dem ahead in 13 races and the Rep ahead in 7. The Rep has a statistically significant lead in 5 races and the Dem in 6. Of those too close for statistical significance, the Dem has an edge in two and the Rep in none. Of the true tossups, the Dem is "leading" (by a statistisical phantom!) in 5 and the Rep in 2.

But, these races are overwhelmingly in Republican districts, and there lies the really interesting story. Of these 20 seats, 16 are currently held by Republicans, and 13 have a Republican incumbent seeking reelection. Given the usual incumbency advantage, we should expect these seats to be going overwhelmingly for the Republicans, yet they are not.

Of the16 currently Republican districts, seven are leaning Rep, while 9 are leaning Dem. Yet of that 9, only 3 are clearly (i.e. by a statistically significant margin) favoring the Democrat. Two are possibly favoring the Dem, and four(!) are way too close to call though with the Dem ahead by a point or three. Still, to even break even in seats held by the opposition is quite a remarkable acheivement by an out-party. Leading (even if only by a ghost) by 9 to 7 is remarkable.

Of the four seats currently held by Dems, three seem secure, with Dems holding a statistically significant lead. In one case, IL-08, the polling shows a very slight Dem lead.

If we threw caution to the wind and ignored the confidence intervals, we'd see the potential for a net gain of 9 seats for the Democrats out of this group of 20 districts, or over half what the Dems need to retake the House. If we prefer a bit of caution, we'd see a likely gain of 4-5 seats with 7 way too close to call. And if we were good conservative statisticians, we'd say (maybe!) a gain of 3, with 9 seats too close for a statistically significant lead by either party.

Some caution is needed in interpreting these results. The polling was done by "interactive voice response" interviewing, that is a recorded voice asks the questions. This produces very low response rates, though usually from a good sample of telephone numbers. In this case, the survey also used listed numbers only. That is required in order to be sure which congressional district a respondent lives in. But it costs the loss of all unlisted numbers, which can be significant especially in urban areas. This is a common tradeoff in sampling congressional districts, but deserves some caution.

Finally, some other reports based on these data have included the 7 races that did not name both candidates but used "the Democratic/Republican candidate." There is excellent reason to think that this "generic ballot" format overstates the vote for Democrats, so I have excluded those races from my analysis. I think including these races significantly overstates the number of seats the Dems are likely to win. (See, for example, WI-08.)

This is a great study, even taking the cautions into effect. I hope we'll see more!

The races included in this group of 20, and the 95% confidence interval is listed in the table below.


The "margin" is Dem minus Rep percent in the table above.


Click here to go to Table of Contents

Monday, August 28, 2006

Generic Ballot: New polls mostly below trend


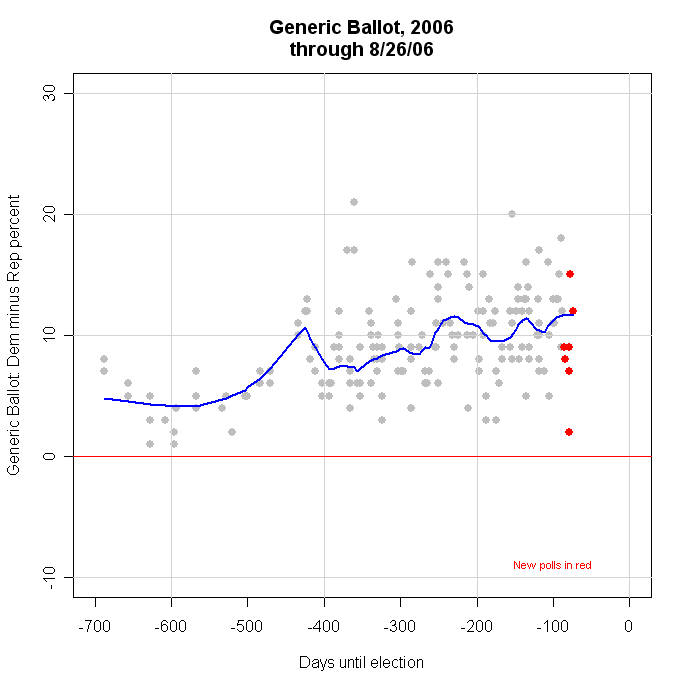
Recent Generic Ballot polling has fallen a below the trend estimate. In polls taken since the British terror plot against airlines, five of the seven polls have shown a reduced Democratic advantage. The largest change is the Gallup poll, which on other grounds appears to be an outlier. However, other less extreme results also show some rise in Republican support. The effect of this is not to turn the trend estimate down, but to flatten it at +12 for the Democrats.

Estimates that are more sensitive to the latest polls show a slight downturn in the trend, but those are also subject to being heavily influenced by the Gallup outlier. For that reason I favor the more conservative estimate.

Interestingly, the post-plot polling does not show any evidence for an upturn in overall presidential approval. It would seem a little odd if the plan plot affected the congressional ballot but not presidential evaluations. So for the moment I think the trend estimator reading "steady" rather than changing is supported by the evidence.


Click here to go to Table of Contents

Friday, August 18, 2006

Votes, Seats and the Generic Ballot


This is a "good news/bad news" story. For Democrats it is good news/bad news and for Republicans it is bad news/good news. It is all about how to convert the generic ballot into votes, and votes into seats.

Yesterday Jay Cost posted an excellent analysis of the generic ballot on RealClearPolitics.com. Here I want to illustrate one of the things he wrote about, and expand a good bit on the problem of going from the generic ballot to the national vote and on to the number of seats won. My colleague at UCSD, Matt Shugart, has also ventured down this road at Fruits and Votes with a very interesting analysis. I'll try to add something to both.

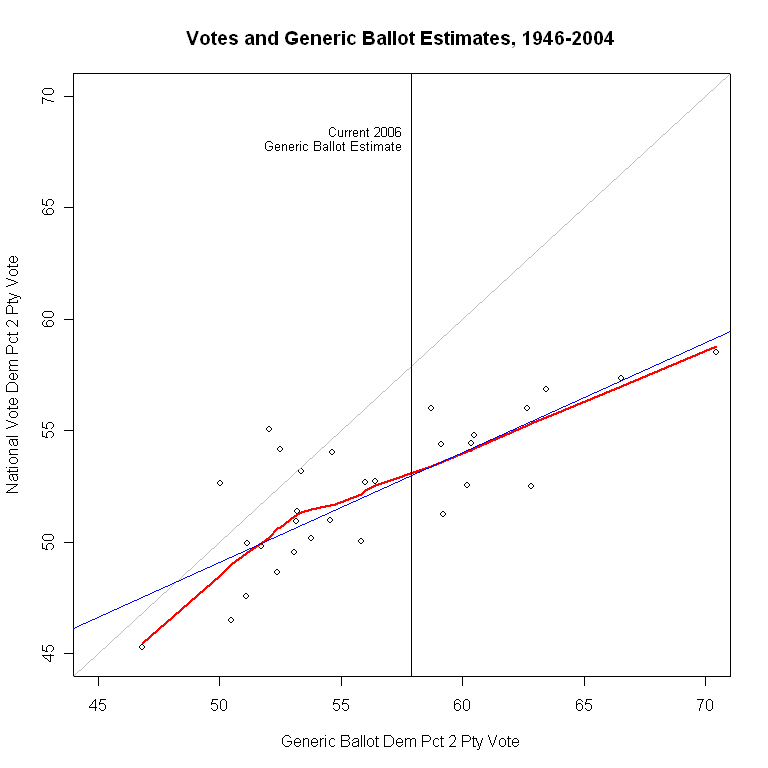
The graph at the top of this page illustrates two of the main points Cost made. The generic ballot almost always overstates the actual Democratic vote, and this bias (he says "skew") gets worse as the Democrats do better on the generic ballot.

In the figure, the gray diagonal line is where the points should be if the generic ballot exactly predicted the national two party vote. What we actually see is that in all but 3 of the last 30 elections, the polls fall well below this gray diagonal line-- they overstate the Democratic vote. Further, the gap between the points and the gray diagonal line gets larger as the generic ballot favors the Democrats more and more. This is exactly Cost's first two points, and the evidence is very clear.

(Technical notes: The straight blue line is the linear fit of actual vote to generic ballot, and the red line is my usual "local regression" which more flexibly fits the pattern of the data, without the assumption of a linear relationship. In this case, above about 53% Dem on the generic ballot we have a fit that is quite linear. Below that the red line tails down quite a bit, showing that even for low Democratic support in the generic ballot the poll still overstates the actual Democratic vote. I use two party vote because it is a better predictor of seats won than using D and R shares of the total vote. I also convert the "don't knows" in the generic ballot by allocating them equally to each party because this gives (somewhat) better predictions of the actual national vote than does allocating them proportionally to those who have decided. I then estimate support for the Democrats on the generic ballot as of election day using all the polls for the election year and estimating the value that the trend would predict on election day. This way I avoid using a single "September" poll, or any other method that throws out information. The method I'm using here is not all I could wish for, and I hope to make technical improvements in the coming days and weeks, but it is "good enough" for now. From here on, when I talk about "generic ballot" or "generic ballot estimate" I mean the estimate as of election day using this method, not a single poll result earlier in the campaign.)

The first bit of "good news" for Dems is that despite these problems, it is still the case that as the generic ballot goes up for Dems, their national vote share has also generally gone up. So if we throw out all the econometrics and just ask "Does higher generic ballot support usually mean higher vote share on election day?" then the answer is yes. (Rapidly followed by the qualification that the relationship has a good deal of variability so we can't be very certain about specific predictions.) As I showed in an earlier post here, the 2006 election cycle is showing the highest support by far for Democrats on the generic ballot of any election since 1994. So without quantification, that must be good news for the Dems.

With a bit of quantification, the current estimate for the Dem share on the generic ballot, projected out to election day, is 57.9%. Taking account of the overestimation, either the linear or the local model give the same prediction: the Dems should be expected to win about 53% of the national two party vote. The uncertainty (about which I will have very little to say here, but perhaps more later) of this prediction is considerable: +/- 3.3%, or from 49.7-56.3%, which is quite a wide range. (And actually, that +/- 3.3% is too SMALL a margin of error. I just don't have time to calculate a better one this morning.) Still, all the caveats aside, this prediction is for the best year than the Democrats have had since 1990, at least in terms of the national vote.

(Robert Erikson and Lee Sigelman have an interesting article on the generic ballot in Public Opinion Quarterly, 1995. They point out that there are additional variables at work here, one of which is party control of the White House. Likewise Alan Abramowitz at Emory has a forthcoming article estimating seat change as a function of past share of seats, midterms, presidential approval, generic vote, open seats and challenger quality. By including some or all of that I could improve the fit of my model. However, my goal is to illustrate the relationships and the basic problem, rather than produce the best forecasting model, so I'll not go that route here.)

But House races are won or lost in 435 separate contests, not one national race. So how does the generic ballot do when predicting the number of seats the Democrats might expect to win? We'll look at that two ways, first directly, then indirectly.

We can plot the Democratic seats in the House against the generic ballot estimate for each year. That produces the graph below, again with a blue linear fit and a red local fit.


The magic number here is 218 seats for a majority, marked by the horizontal red line. Once more we see that the better you do on the generic ballot, the more seats you tend to win, but we also see a lot of variation around that relationship. In particular, we see that in the 8 congresses since 1946 that were controlled by Republicans, the linear fit fails to predict the Republican majority 7 of 8 times. We also see that 7 of the 8 Republican congresses came from generic ballots in the 50-55% Dem range. However, there were 8 other congresses in this same range of generic ballots but which were easily held by Democratic majorities. That's poor prediction when it counts most. We'll return below to this problem of explaining the Republican congresses.

We also see in the figure that given the estimate for the 2006 generic ballot of 57.8%, we should expect to see a large Democratic majority, with an astonishing 252 seats. That would be a 49 seat increase, which seems wildly out of touch with current opinion that Democrats MAY not quite manage to gain the 15 seats needed for a majority. And again the uncertainty is huge: +/- 43 seats! (So between a 6 seat gain and universal domination at 295 seats. One suspects even Democrats don't think 295 is very likely.) Again, this uncertainty could be reduced by adding other predictor variables. But my point is that those who wish to rely on the generic ballot in thinking about likely outcomes have to grapple with both seemingly unrealistically high predictions based on past elections and an embarrassingly wide margin of error.

Still, the good news for Dems is that high generic ballots do tend to go with more seats. Bad news for Reps.

We've seen the perils of predicting national vote from generic ballot, and likewise for seats. But let's pause for a moment. Suppose we actually could get a PERFECT prediction of the national vote shares from the generic ballot (or any other source for that matter.) How much would that help us predict the outcome of the battle for control of the House?

The graph below plots the number of Democratic seats against the national vote share won by the Democrats, so here there is no error in the vote measure. Rather the variability that comes in is due to the fact that national vote totals don't translate directly into seats as they would in a proportional representation system. This "Votes-Seats" relationship lets us appreciate how much uncertainty there is in party control, EVEN IF WE TOOK OUT ALL THE UNCERTAINTY in the generic ballot.


Here the relationship is tighter, as it must be, than for the generic ballot. Still, the variation around the blue regression line is about +/- 19 seats for any given level of actual votes. That's more uncertainty than what the Dems need to gain to take control, so it seems unlikely we could readily forecast with confidence who will win the House, even if we knew the final vote today.

But not to let that stop us, translating the generic ballot at 57.9% into a predicted national vote of 53.0% gives the vertical black line in the figure. It crosses the blue regression line at 251 seats, essentially the same estimate we got from directly estimating seats from generic vote.

So what can we say? IF the pattern of relationships between generic ballot and votes, and between votes and seats held in 2006 as it had from 1946-2004, then we should expect an easy Democratic capture of the House, and with much room to spare. (but remember all that uncertainty we are ignoring in rushing to declare a Democratic victory.) Still, uncertain as we are, that would be the smart way to bet.

That's the last of the good news for the Dems. Now the Reps get their turn.

The "catch" in that last paragraph is the phrase "IF the pattern of relationships ... held in 2006 as it had from 1946-2004". That pattern may not hold. If not, then the predictions will, of course, differ.

But this is not idle speculation. There is evidence that the pattern has in fact differed in the last six elections. And if that difference persists, the Democrats may well fail to take control of the House EVEN IF they do very well in the national vote shares.

In the votes-seats graph immediately above, the blue dots fall pretty nicely around the blue regression line, and the red local regression is close enough to the linear model that I don't think it is worth worrying too much about nonlinearities in the votes-seats relationship. At a glance then, a graph of a linear relationship to write home about, and to use as an example in class. But an example of what? When we add labels for year, a new pattern becomes immediately obvious.

The figure below shows what we should have known anyway-- the points below 218 seats are Republican congresses, 6 of which are from 1994-2004, and two from 1946 and 1952. If we look at these compared to the overall fit line, they don't look too bad. But if we focus on just the 6 points since 1994, we see that they don't show the same votes-seats relationship as the rest of the data do. Seats have been MUCH less responsive to changes in votes since 1994 than in the previous 46 years.


The green line is the votes-seats relationship for 1946-1992. It is quite close to the gray line we estimate using all the data. But the red line is estimated for the 1994-2004 period only, and it is dramatically different. From 1946-1992, a one-percentage point gain in the Democratic share of the national vote produced a gain of 8.2 seats (and vice versa for Republicans.) Since 1994, a one point gain in votes has produced a gain of only 1.9 seats. The translation of votes into seats has become dramatically less responsive. This is the curse of the Dems in trying to gain a majority, but also the curse of the Reps in trying to expand theirs.

It is true that during this period votes have held to a relatively narrow range of about 46%-50% Democratic (a bit wider though than Michael Barone's 49-49 nation notion.) Yet under the "old" votes-seats relationship this would have accounted for shifts of some 33 seats. In fact the number of seats has shifted by only 10 over this period.

And this is the good news for Reps and the very bad for Dems. IF the votes-seats relationship in 2006 follows the pattern of the past six elections, then EVEN THE EXTRAORDINARY SUCCESS currently forecast by the generic ballot may not be enough to give Dems control of the House. In the figure above, the red line for the 1994-2004 votes-seats relationship remains below the magic 218 seats even when Dems win the 53% of the national vote which current generic ballot results would predict. Rather than the 251 seats they would be able to expect under the 1946-1992 relationship, they will expect only 215 seats, 3 short. The Dems would need 55% of the vote to reach a predicted number of seats of 218, and even the current excellent generic ballot results are not enough to sustain that number of national votes.

So, while the generic ballot looks the best (from a Democratic perspective) in years, and in the past would have been plenty of reason to expect to win the House, the votes-seats relationship appears to have changed so much that control may remain beyond the Dems' grasp. Good news, Reps. (If I was worrying about uncertainty here, I'd be insisting that there is so much uncertainty that the small gap between 215 and 218 seats means the race for control is essentially a flip of a fair coin.)

One question is whether we should believe that the votes-seats relationship has really changed, or is this just a fluke of these particular six elections. Maybe there have been lots of groupings of six elections in the last 60 years that would give us equally flat, but transitory, votes-seats relationships.

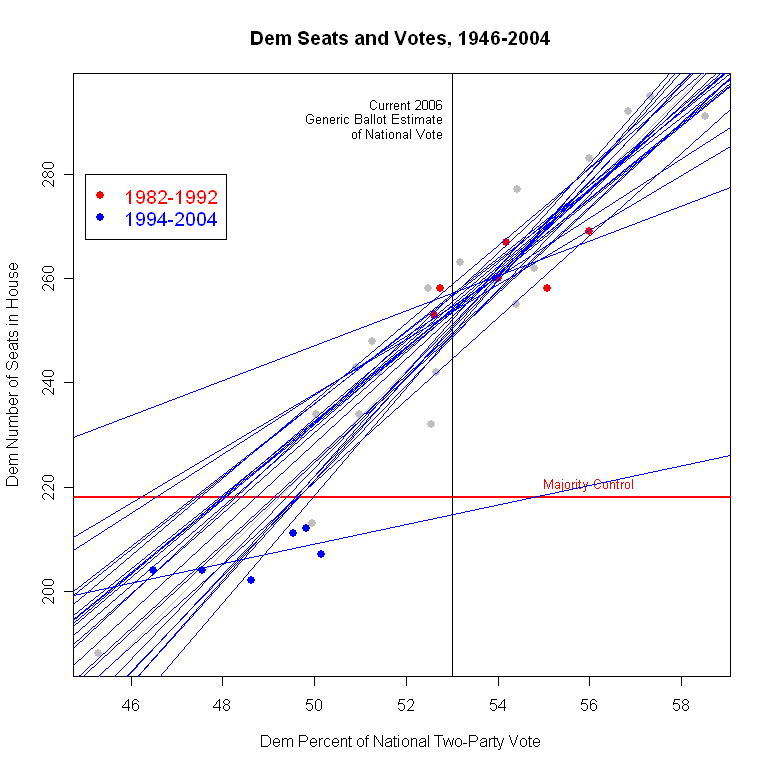
In the graph below I test this. I run a separate regression for all possible groupings of six consecutive elections since 1946. I plot one blue regression line for each group of six years, 25 estimates in all. If the votes-seats relationship is unstable, we should see lines going every which-way, like a dropped bowl of chopsticks.


That doesn't happen. All but two of the 25 lines are pretty close to the overall line based on all years. The largest departure from the overall pattern is clearly the 1994-2004 line we saw in the previous graph (though now colored blue rather than red.) In these sixty years, only one set of years had a similarly small slope. That line is for 1982-1992, and is the highest line in the top left quadrant of the figure. Yet even then the slope was 3.3, compared to 1.9 now. Moreover, that estimate is sensitive to the data in a way the the current period is not. The 1982-92 period is marked with red dots. With only six points, it is normal for the regression line to be sensitive to which six points are included. (Which is why the stability of the OTHER 23 lines is remarkable.) But if we look at the red points, it is easy to see that there are two or three points that are crucial for determining the slope of the line. The estimate is quite sensitive to the data.

In contrast, if you look at the blue dots for 1994-2004, no single point is very influential in determining the slope. Remove any one, and the rest continue to produce essentially the same line, with a very small slope. So I could argue that the 1982-1992 period is more of a fluke of particular elections, but I cannot make the same case for the current period.

(Why these two sets of years? It might be redistricting which got more sophisticated in the 80s, and still more so each decade since. It could be an increase in incumbency advantage, independent of redistricting. It is interesting that the two periods with smaller slopes come consecutively, suggesting that structural or behavioral changes drive the changing votes-seats relationship. But that's a story for another day, as are the normative implications of a much less responsive "People's House", in the sense of seat change in response to vote change.)

This means that I would be very reluctant to assume that the historic relationship between votes and seats is still true. (And a statistical test confirms that the slopes differ to a statistically significant extent between 1946-1992 and 1994-2004.) And the implication of that is that even a very successful vote for Democrats need not translate into control of the House.

If we shifted to a race-by-race evaluation, we might well reach different conclusions. The national vote doesn't need to change by much if the shifts are concentrated in exactly the right districts, and those who know such things (Charlie Cook, Stuart Rothenberg, CQ) tell us there are many more competitive races than expected eight months ago. That should raise the uncertainty and anxiety for both parties.

But if you are betting on the generic ballot to predict control of the House, even when it looks awfully strong for Democrats, you might want to think again. The relationship has weakened and the uncertainty is huge.


Click here to go to Table of Contents

Tuesday, August 15, 2006

Generic Congressional Ballot


Congressional election outcomes are among the most interesting yet difficult to gauge indicators in American politics. The race for control of the House of Representatives is the aggregate outcome of 435 separate races, each with its own dynamics and each with its own unique features, plus the power of incumbency and the fact that though we hate congress, we love our congress(wo)man.

The blunt instrument pollsters use to estimate the state of the race for control of the House is some variant of
"If the election for U.S. House of Representatives were held today, would you vote for the Democratic or Republican candidate in your congressional district?"
The problems with the question are obvious: no mention of who your candidates are by name (and many voters don't have a clue) or who the incumbent is (a huge advantage in name recognition alone, not to mention positive generalized affect) and the likelihood that uninformed voters reply by reflecting their partisanship rather than anything specific to the race.

NONETHELESS, this is the indicator we have, and we follow its ups and downs with great interest.

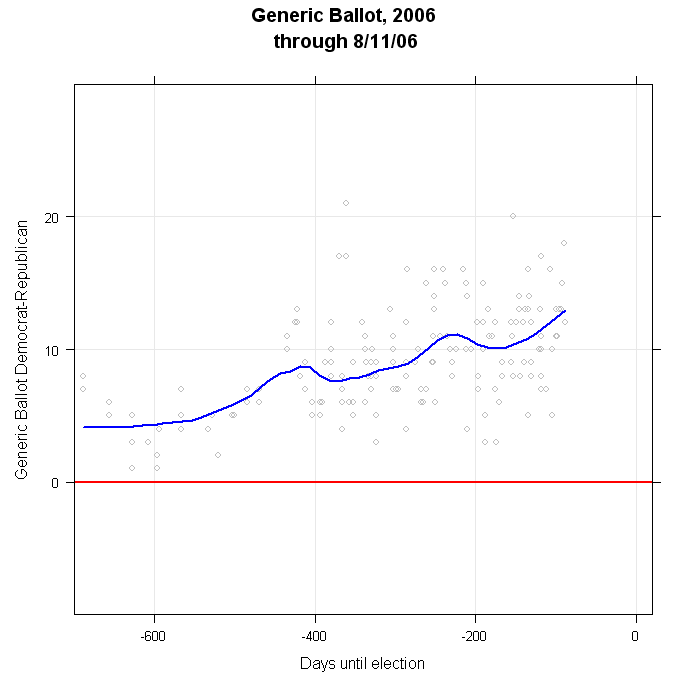
At the moment, this indicator looks quite favorable for the Democrats. Since the 2004 elections, the share of voters preferring the Democrat over the Republican has climbed steadily. There is considerable variation from poll to poll, but the current estimated trend is a Democrat lead of +14.65%.

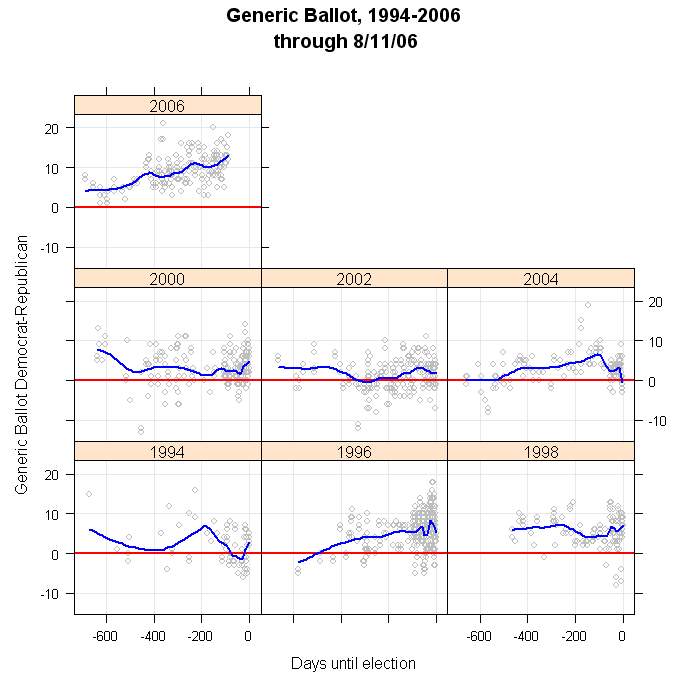
There has been a long-term tendency for Democrats to do better on this generic ballot question than they in fact do at the polls, so considerable care is required in thinking about this number. If a Democratic lead in the Generic Ballot were sufficient for control of the House, the Democrats would have won the House in 5 of the last 6 Congressional elections, including 1994! The trend estimates for each year, as of election day are:

2004: -1.07
2002: +1.49
2000: +5.26
1998: +8.03
1996: +5.45
1994: +3.35

Nevertheless, the current margin in the Generic Ballot is very large by comparison to recent election years. If we plot the polls and the trend since 1994, we find that 2006 is by far the largest Democratic lead at a comparable time in the election cycle:


In no cycle since 1994 has the Democratic lead approached 10%, let alone exceeded it. So by the standard of "relative lead" in the generic ballot, 2006 reflects extremely strong pro-Democratic forces.

Using the generic ballot to forecast the actual House outcome? That's a story for another day. (Update 8/17: Jay Cost now has an excellent discussion of the generic ballot on RealClearPolitics here. He discusses, among other things, the difficulty of estimating seat changes from the generic ballot, a topic I'll have more to say about here soon as well.)


Click here to go to Table of Contents

Tuesday, August 01, 2006

Bush Approval: Cook/RT at 39%


The new Cook Political Report/RT Strategies poll taken 7/28-30/06 finds approval of President Bush at 39%, with disapproval at 51%. This poll is of registered voters. The 39% approval is up two points from June 4th and up three points from April 30, near the low point of my estimated approval trend. The addition of this poll puts my trend estimate at 37.96%, so let's call that 38%. The blue trend line continues up, though at a noticably slower rate than in May and early June. Since mid-June approval has risen by about 1%, while it climbed by 3 points the previous month (May 15-June 11).

If I use my more sensitive "red line" estimate, then approval appears to have been flat since mid-June. I didn't plot that this time. "Hasty red" is clearly having a tough time deciding what the trend should be. Last week it was a bit down, and I wrote a piece asking if Bush was again in decline. All the polls since then have reduced that estimate to where it now stands at no change. This is an example of "hasty red" suggesting something that seems to have been too much response to a couple of polls. My standard "blue line" estimate meanwhile has continued to show a mild gain since mid-June. For now, I'm sticking with it-- but always watching for Red to give us a hint. Right now, that hint isn't very convincing!

With events in the Middle East plus the summer doldrums at home, I'm not making any bets which way approval is going to move next. You can make cases for either direction. So I'll stick to the thing I do have confidence in-- "old blue".

It has been a while since we looked at approval by party identification, and the Cook/RT poll gives us a nice comparison. They include strength of approval, which many others do not do. That lets us look a little deeper than the simple dichotomy, and by party id categories.

The graph below divides approval into seven categories: strongly approve, somewhat approve, lean towards approval, (neither, not sure, mixed, don't lean either way), lean disapprove, somewhat disapprove and strongly disapprove. The rows of the figure correspond to these categories from top to bottom. The columns are the three party identification categories.

The thing that jumps out of this figure is the very large strongly disapprove group among independents. Fully 46% of independents strongly disapprove of the President's handling of his job. That compares to 59% among Democrats. Just visually comparing the independent with the Dem columns of the figure shows how much independents resemble Democrats at this point. They certainly don't evenly split the difference between Dems and Reps. And that isn't just mild disapproval-- by far the largest single category among independents is strongly disapprove.


The two partisan camps are approximately symmetric: 78% of Reps approve strongly or somewhat, while 76% of Dems DISapprove strongly or somewhat. What tips the balance against the White House is the large group of unhappy independents: 56% of whom disapprove strongly or somewhat. Only 27% approve strongly or somewhat.

As we come into the fall campaign, I wonder if these disapproving independents can be persuaded to back Republican congressional candidates. These folks are not natural supporters of Dems but they seem so put out with the President that I'm not sure a campaign based on anti-terrorism can win them over again. Despite a first ever veto (and failure to override) I'm not sure there is much daylight between the Republican congress and the White House. I expect a number of districts will swing one way or the other on the votes of these unhappy independents. Can they be won back? How? And the flip side of that question: Can Democrats capitalize on this dissatisfaction when the congressional race is between two particular candidates, and not just a referendum on Bush's performance? We know the generic ballot has been favoring the Dems for a while, but then it has done that most of the years since 1994 without a change in control of congress. Any evidence? Yes, thanks to the Cook/RT poll.

The Cook/RT poll uses the following question on preference for control of Congress, rather than the usual "generic ballot" house vote:
Now, thinking about the election for U.S. Congress in November, regardless of how you might plan to vote in your own district, which party would you like to see in control of Congress after the congressional elections in November: The Democrats or the Republicans? (If not sure:) Well, which way do you lean, more towards the Democrats or the Republicans?
This item may or may not predict individual House votes well, but it does give us a measure of preference that lets us look at how independents split on this question of control compared to their substantial disapproval of President Bush.

The categories shown as rows run from "Prefer Rep Control", "Lean Rep", "Undecided", "Lean Dem" and "Prefer Dem Control", as we go from top (Red) to bottom (Blue).


That dissatisfaction among independents translates only partially into support for a Democratic congress. While 45% of independents say they prefer a Democratic Congress, this pales by comparison to the Democrats where an overwhelming 90% say the same. That's not at all surprising, but while Independents disapprove of Bush in numbers not too far behind those of Dems, this doesn't translate as strongly into a preference for Congressional control.

Republicans can hardly rest easy from this figure, however. They would need to capture all the undecided and leaning independents in order to break even on the control question. Barely a quarter (26%) of independents say outright they prefer a Republican Congress, while 45% pick the Democrats. That is a lot of ground to pick up for Republicans.

Finally, Republicans have often been more loyal to their party than Democrats. In this figure, there is a small deficit in Republican loyalty: 80% of Reps want a Republican Congress, 10 points less than the Democratic preference among Dems.

Everyone should know the dangers of using this or other "generic ballot" questions to forecast actual votes, let alone swings in seats. But the data do speak to the difficulties Republican's face in the fall elections. Approval shows a massive deficit among independents, and the preference for control suggests that at the very least the Republican party has to win over the vast majority of wavering independents. (At least given this kind of "national level view". If you want district by district analysis, go to the Cook Political Report!)


Click here to go to Table of Contents