RT Strategies and Constituent Dynamics have produced a very interesting look at 30 competitive House races. See their results at their web site here. What sets their polling apart from most others is that these are samples of about 1,000 respondents within each congressional district. Further, the vote question uses the names of the candidates, not a "generic vote" format that asks only if you would vote for the unnamed "Democratic or Republican" candidate. (RT/CD DID use the generic form in the districts that have not yet held contested primaries. There are seven of those in their sample, which I have excluded from my analysis. In addition, interviewing is not yet complete in three districts. So my analysis is based on the 20 districts with named candidates and completed interviews.)
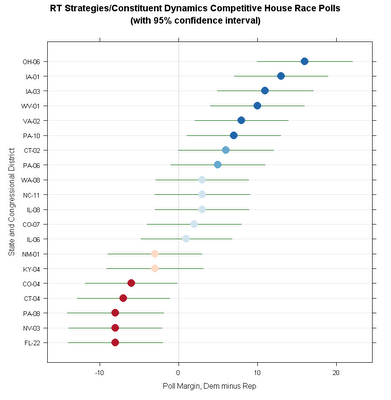
The graph above shows the distribution of the polls, using the margin between Dem and Rep, with the 95% confidence interval shown. Where the margin is greater than 2 standard errors from zero, I've colored the dot dark red or blue; where the margin is between 1 and 2 standard errors from zero I've colored it light red or blue, and where the margin is less than one standard error I've given it just a slight tint.
A glance at the figure shows the Dem ahead in 13 races and the Rep ahead in 7. The Rep has a statistically significant lead in 5 races and the Dem in 6. Of those too close for statistical significance, the Dem has an edge in two and the Rep in none. Of the true tossups, the Dem is "leading" (by a statistisical phantom!) in 5 and the Rep in 2.
But, these races are overwhelmingly in Republican districts, and there lies the really interesting story. Of these 20 seats, 16 are currently held by Republicans, and 13 have a Republican incumbent seeking reelection. Given the usual incumbency advantage, we should expect these seats to be going overwhelmingly for the Republicans, yet they are not.
Of the16 currently Republican districts, seven are leaning Rep, while 9 are leaning Dem. Yet of that 9, only 3 are clearly (i.e. by a statistically significant margin) favoring the Democrat. Two are possibly favoring the Dem, and four(!) are way too close to call though with the Dem ahead by a point or three. Still, to even break even in seats held by the opposition is quite a remarkable acheivement by an out-party. Leading (even if only by a ghost) by 9 to 7 is remarkable.
Of the four seats currently held by Dems, three seem secure, with Dems holding a statistically significant lead. In one case, IL-08, the polling shows a very slight Dem lead.
If we threw caution to the wind and ignored the confidence intervals, we'd see the potential for a net gain of 9 seats for the Democrats out of this group of 20 districts, or over half what the Dems need to retake the House. If we prefer a bit of caution, we'd see a likely gain of 4-5 seats with 7 way too close to call. And if we were good conservative statisticians, we'd say (maybe!) a gain of 3, with 9 seats too close for a statistically significant lead by either party.
Some caution is needed in interpreting these results. The polling was done by "interactive voice response" interviewing, that is a recorded voice asks the questions. This produces very low response rates, though usually from a good sample of telephone numbers. In this case, the survey also used listed numbers only. That is required in order to be sure which congressional district a respondent lives in. But it costs the loss of all unlisted numbers, which can be significant especially in urban areas. This is a common tradeoff in sampling congressional districts, but deserves some caution.
Finally, some other reports based on these data have included the 7 races that did not name both candidates but used "the Democratic/Republican candidate." There is excellent reason to think that this "generic ballot" format overstates the vote for Democrats, so I have excluded those races from my analysis. I think including these races significantly overstates the number of seats the Dems are likely to win. (See, for example, WI-08.)
This is a great study, even taking the cautions into effect. I hope we'll see more!
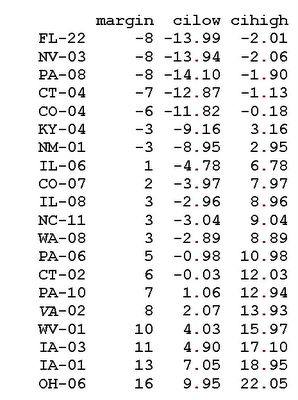
The races included in this group of 20, and the 95% confidence interval is listed in the table below.

The "margin" is Dem minus Rep percent in the table above.
Click here to go to Table of Contents