Monday, January 30, 2006

Bush Approval on Eve of SOTU


Second term approval ratings based on the Gallup Poll. The vertical line marks the start of the 60th month in office, which is the approximate date of the State of the Union address, but not the exact date for each president. Latest Bush data through polling completed 1/22/06.


President Bush goes into his sixth State of the Union address Tuesday with his popular approval at 42-43%, the second lowest for a two term president at this point in his tenure. While the President's approval rating has significantly increased since early November, it has remained in the 42-43% range since mid-December. State of the Union addresses have sometimes given presidents a boost in the polls, but not always. Of two term post-war presidents giving their sixth address to Congress, only Clinton and Nixon received a positive bounce (and Nixon's was quite small). Truman's, Eisenhower's and Reagan's sixth State of the Union speeches produced no noticeable change in approval at all. President Bush would benefit from an effective speech on Tuesday to rally his Republican supporters in Congress and to overcome the recent inertia in his public standing with voters. If he achieves this, he will be winning against the historical average.

Among second term presidents, President Bush's approval rating, though improved, ranks above only Nixon and slightly behind Truman. For the start of their sixth year in late January, approval for these six presidents has been:

Truman, 45%, 1/13/50
Eisenhower, 58%, 1/29/58
Nixon, 26%, 1/21/74
Reagan, 64%, 1/13/86
Clinton, 62%, 1/21/98
Bush, 43%, 1/22/06


President Bush's approval numbers in the perspective of his entire term look like this:


Approval of President Bush, 2001-2006. This is based on all public polls reported at PollingReport.com. The blue line is an estimate of the trend in approval, the gray dots are the individual poll results, which randomly scatter around this trend.

The President's support has suffered throughout his term from the unsustainable high following the attacks on September 11. As approval inevitably declined from that point, the President received boosts at the start of the Iraq war and the capture of Saddam Hussein. These surges, however, have been short lived, with the downward trend soon reappearing. The exception to this downward movement was the 2004 election campaign, a period in which the President's approval rose, peaking shortly after the 2004 general election. The year 2005 returned to the previous pattern of declining support, however, until the reversal begun in early November. That increase stabilized in mid-December and has remained constant at 42-43% since then.

The 2005-06 trends can be seen in greater detail below.


While some individual polls have registered relatively high approval ratings, these have not been sustained in the same polls, which in January have shown results consistent with the range of other polls and an overall approval estimate of 42.5% as of January 26 polling.

Presidents can try to set the agenda with the State of the Union. In 2005, President Bush did that by announcing his aim to change the Social Security program. After devoting a great deal of White House effort to that goal, public and Congressional approval failed to come around to the President's position. That high visibility domestic initiative was what the President spent his "political capital" on in 2005, without any return on the investment. The 2006 State of the Union gives him a new chance to set out a domestic agenda that will win the support of both the public and the Congress.


Data: The full Gallup Poll series of presidential approval is freely available at the Roper Center website here. Current polls are available at the PollingReport.com here.

Friday, January 27, 2006

Palestinian Exit Poll Errors on National List Vote


The three Palestinian Legislative Council election exit polls tended to overestimate Fatah's vote in the national party list voting but they all seriously underestimated Hamas' strength. The result is that all got the leader wrong, and this was beyond the margin of error of two of the three surveys (and at the extreme end of the MOE of the third, and least precise, survey.) The bottom line: the preliminary vote count produces results that fall outside the margin of error of the exit polls. But even regardless of technical issues, the serious underestimate of the Hamas vote presents interesting questions about why this happened, both technical and political.

The national party list vote is the basis of a proportional representation allocation of 66 seats in the legislative council. While the district votes have serious challenges to exit polls (see here), there is nothing in principle so difficult about conducting an exit poll for a party list ballot such as this. Therefore the problems with this part of the exit poll are different from those I discussed before concerning the district votes.

The three polls were conducted by the Opinion Polls and Survey Studies Center at An-Najah University ("An-Najah" in the graph), the Palestinian Center for Policy and Survey Research ("PSR" in the graph) and the Development Studies Program at Birzeit University ("DSP" in the graph).

(This part gets really geeky. Fun for me, but perhaps not for anyone else! Read at your peril.)

The exit polls differ in the clarity of their technical details. The PSR poll is described in the most detail on their web page. The exit poll interviewed 17573 respondents at 242 polling centers from a total of 1014 centers. The margin of error for the national party list percentage is reported as 4%. Given the clustering of the sample involved, this strikes me as a reasonable estimate, and the PSR deserves praise for being clear on these technical but statistically crucial issues.

The DSP exit poll is less clear on the matters of respondents and margins of error. Their web site includes a PowerPoint presentation of their results, produced on election night. Unfortunately it fails to give any estimate of the margin of error for reported votes or seats estimates. I have to rely then on an Associated Press story from election night which quotes DSP pollsters as saying their poll interviewed 8000 voters at 232 polling stations. The AP report quotes them as saying there is a "one-seat margin of error. Pollsters did not give the margin in percentage points." That is a bit of a puzzle. The "Exit Poll Fact Sheet" posted at the DSP website says they planned to interview 15000 respondents, though it does not indicate what the expected margin of error would be for their sample design. If the AP story is correct and they completed just more than half the expected sample, then that is bad news. At the same time, a "1-seat margin of error" is hard to understand. The Palestinian national party list vote is a strong PR system with a 2% threshold for winning seats. That would mean that seats are very closely related to votes. With 132 members, the Legislative Council would therefore have a "seat margin of error" only slightly more than the "percent of vote" margin of error. But 1-seat or 1% seems very optimistic.

So I've made my own calculation of a plausible margin of error for their survey. Based on a sample size of 15000, and using the same design effect as in the PSR survey, I estimate a margin of error of 4.3% for the DSP study. If their sample size were really only 8000 then this MOE rises to 5.9%. In the graphs I adopt the estimated MOE based on their "Exit Poll Fact Sheet".

The An-Najah exit poll is the most poorly documented. Their web page has no mention of the exit poll, so only press accounts are available. An Associated Press article (not the same as the one mentioned above) quotes an anonymous An Najah pollster as saying the exit poll interviewed 6500 voters with a margin of error of 5%. That is possible, though for that sample size and the same design effect as the PSR poll, the margin of error would be more like 6.5%.

The reason I'm using the PSR design effect is that there isn't much magic available for exit polls. The design effect depends on the number of clusters (polling places) in your sample, the number of voters in each, and any efficiency you can squeeze out by stratifying on some relevant political variables, like past vote or known regional differences in voting patterns. The PSR account is the most thorough and clear, and from it I can calculate a design effect, that is, the inflation of the margin of error using the clustered design compared to what would be the MOE for a simple random sample. While different designs might differ slightly, I doubt that any decent design would vary by much from any other in this case. Hence I use the PSR calculation (which is well documented) and apply that to the DSP and An Najah polls where I have less documentation.

Which is a long way of saying that for the graph above, I've used the PSR and An Najah reported margins of error (4% and 5%, respectively) and my estimate of the MOE for DSP based on the planned 15000 voter sample with the PSR design effect, or a MOE of 4.3%. I should stress that my estimates here are just that, and I will gladly revise them if I can find more documentation from the pollsters. However, I'd be surprised if any of these polls had margins of error much beyond the 4-6% range, given their sample sizes and similar levels of clustering.

(OK, back to the substance here.)

In the graph above, the striking thing is the underestimate of the Hamas vote. All three polls get estimates substantially too low. The truth (the vertical red line) lies outside the confidence interval for PSR and DSP, and just barely touches the extreme high end of the confidence interval for An-Najah. It is fair to say from this that all three polls seriously underestimated the Hamas vote, and that the errors were due to something systematic, not random variation in the sampling.

So what could be the reason for this? One possibility is that Hamas voters were a) less willing to talk to the pollsters or b) less willing to admit to a Hamas vote when they did fill out the exit survey. The first possiblity is similar to the problems US exit pollsters had in 2004, where the evidence is that Republican voters were somewhat less willing to respond to the exit survey, producing an underestimate of the Bush vote. In this case, if we imagine Hamas voters as being very unhappy with the status quo and with the Palestinian "establishment", it is plausible that this unhappiness might transfer to being less willing to coopertate with pollsters from "established" Palestinian institutions. In this case, the errors would be due to systematic non-response, a problem that bedevils all surveys. The second possibility seems somewhat less plausible to me. While Hamas has been an "outlaw" faction in Palestinian politics, it does not seem to me to be a stigma that would lead voters to underreport their support for Hamas. For example, Hamas did quite well in recent local elections. Their legitimacy would seem to be well established by that success and by their very willingness to take part in these elections, having boycotted the 1996 legislative elections. Now I don't claim to be any kind of expert on Palestinian politics or culture, so I may be missing something here, but it doesn't seem to me that reporting a vote for Hamas would be all that socially unacceptable that it would lead to this big a bias in the estimated Hamas result.

There is a third possible reason for the underestimate of Hamas vote. There is very little historical data on Palestinian elections which can be used to create estimates of turnout. We saw in another post here that turnout was up substantially from the 2005 Presidential election, and Hamas and other boycotted the 1996 legislative elections. So it is also possible that the exit polls were making assumptions about turnout which were not well founded. An unexpectedly high turnout in pro-Hamas areas could be underestimated based on past elections data, and this in turn could lead to underestimating the Hamas vote.

Whichever of these three (or other) possible explanations for the underestimate of Hamas strength, the fact remains that the problem with these exit polls came primarily in the failure to accurately estimate the strengh of Hamas.

If we turn to Fatah, the confidence intervals for all three polls at least touch the actual outcome. An-Najah and DSP overestimate Fatah strength, and the truth comes only at the very low end of their confidence intervals. PSR hits the Fatah vote on the nail, squarely in the middle of its confidence interval. So not great, but not bad estimates under the circumstances. An implication of this is that Fatah voters were willing to be interviewed, that Hamas supporters might possibly have mis-reported Fatah votes, and again the turnout estimates might have inflated the Fatah strength a bit.

But the proof of the pudding is in the estimated gap between Hamas and Fatah. This is the statistic that tells you who is ahead, by how much, and whether that is statistically significant. Here two of the polls clearly miss the mark, and An-Najah barely touches the truth (in part thanks to its larger margin of error.) All three estimate Fatah leading by 6-7%, when the truth was a Hamas lead of 3.27%. This can again be explained by the factors that drove the Hamas underestimate combined with any systematic factors inflating the Fatah vote.

The bottom line is that the exit poll errors cannot be explained by random variability due to sampling. Systematic response errors, turnout estimation, or non-response are likely culprits in this case. In principle, an exit poll should have been able to detect the Hamas lead. With the sample designs used here, and their associated margins of error, it is unlikely any of them could have concluded that Hamas' lead was statistically significant. But getting the direction right was a possibility.

One refreshing aspect of these exit poll problems is that they do not easily lend themselves to the conspiracy theory interpretations common after the U.S. 2004 presidential elections. With ballot counting conducted under the Palestinian Authority, any fraudulent counting would seem more likely to favor Fatah than Hamas. Sometimes the exit polls are just wrong. We should all remember that lesson (and continue to strive to improve the science of exit polls.)

Palestinian Exit Polls Faced Impossible Task


Distribution of margin separating district candidates in Palestinian Legislative Council elections.

In multi-member district voting the percent of the vote separating candidates is an indication of the intrinsic statistical difficulty of estimating winners based on exit polls. For example, in a district with 5 seats, the critical question is what is the vote margin separating the 5th and 6th candidates. If that is large, then you can be more confident that the 5th (and 1st-4th) candidate will win, and that the 6th (and 7th-nth) will lose. However, with many candidates and multiple seats the votes separating the top candidates is likely to be rather small, meaning that the margin of error for any exit poll will almost certainlybe larger than the margin between candidates. This difficulty would affect any exit poll, regardless of problems of response bias, practical difficulties in conducting the poll and so on.

As of Friday at 11:00 CST (19:00 Ramallah) the Palestinian Central Elections Commission (CEC) has not released the final and complete vote tally. They have, however, released the preliminary counts for the winning candidates. That is not the ideal data for this exercise, but is enough to at least illustrate my point and make the case while we wait for the final results.

For each of the 16 districts, I have sorted the winners by their total vote, then calculated the percentage of the vote separating each in order. So for example, if the top candidate won 35% of the vote and the second candidate won 33% then the difference between them would be 2%. Likewise if the third place candidate won 30% then the difference between him or her and the number 2 candidate would be 3% and so on. I calculate this for each of the candidates reported to win a seat by the CEC.

Now, this is not the ideal data! What we really want is the vote for the candidate who just failed to get elected. So if there are 5 seats, we want the vote for the number 6 candidate to compare to the number 5. But those data aren't in yet. I'm using the gaps between winners as an indication of how closely bunched winning candidates were. It is possible that the winners are closely bunched but that all losers fell far behind them. If that turns out to be the case then my argument here falls apart. But until we get the full data, this is the best we have to work with.

So the task of the exit poll is to estimate the vote separating pairs of candidates in order to estimate who has more votes. That is obviously subject to sampling error which depends on the sample size and non-sampling errors that depend on response errors (voters who fail to accurately report their vote), non-response, and any other problems that prevent a completely accurate measurement of voter's actual behavior in the voting booth.

The Palestinian Center for Policy and Survey Research reports that its exit poll of 17573 voters had a margin of error of +/- 4% for the national list vote, and +/-5-7% for the district vote, depending on the number of candidates (and the sample size in the district). Now the margin of error for each candidate is 5-7%. The margin of error for the difference between two candidates is approximately twice that, or 10-14% for the difference to be statistically significant at the 95% confidence level (and U.S. exit polls usually require much MORE confidence than that.)

So what are the chances of reliably estimating who is ahead? The top figure shows that in almost 40% of the cases, any adjacent pair of candidates (that is 1st & 2nd, 2nd & 3rd, 3rd & 4th, etc) were separated by less than a percentage point. Another 30% were separated by one to two percentage points. Only about 5% of all candidates were separated by as much as 5 or more percentage points, well within any reasonable margin of error for an exit poll.

Now, let me stress that this doesn't mean that the next candidate, the one not elected, cannot be far behind those who do win. We just don't have that data yet. Suppose a plurality of voters cast their votes for all Hamas candidates, and a smaller group of voters cast their ballots for all Fatah candidates. Then the gaps between winning Hamas candidates would be small, but the gap between Hamas and Fatah could be large, and the exit poll could detect that.

But consider that while candidates group by parties, they also have individual constituencies that may boost a particular candidate regardless of party. So some candidates do better than their party and some fall behind the party. While Hamas won most of the district seats, Fatah candidates do mix in with these winners. So we can use that to see how much gap there is between winners of different parties where this happened.

The figure below shows the gap between adjacent candidates by election district for those districts with more than one seat. I also exclude those winning candidates who were part of the quota of Christian seats. Their votes usually fall far behind the last winning Muslim candidate.


Jenin is a good example of party mixing. The top vote getters were Hamas, Fatah, Hamas and Fatah with votes of 30761, 29059, 27857 and 26909. Since there were other candidates for Hamas and Fatah on the ballot, I'd certainly expect that the 5th place candidate was close behind the 26909 of the fourth place winner. And the gap separating all these candidates is less than 2.5% of the vote. No exit poll could possibly detect such differences reliably.

In Ramallah, the top four winners were Hamas while the 5th winner was Fatah. The votes for 4th and 5th were 30679 and 22045, a gap of 3% of the total votes cast.

In Gaza the big gap comes between the 5th and 6th place candidates. Here the top five are all Hamas, while the 6th-8th place finishers were all independents. Even here though the gap between 5th and 6th is only 6%.

So, when we ask exit polls to do the impossible, we shouldn't be too surprised if the results are less than satisfying. In U.S. exit polling, few races are called solely on the basis of exit results in anything less than blow-out races. If the results are at all close sample precinct results of actual tabulated vote are used to augment the exit results, and in very close races the margin of error rarely becomes significant based on the combination of exit and precinct returns, awaiting more complete county-level vote reports before a race can be called.

So to attempt to call the district results in the multi-member Palestinian Legislative Council races was probably not a good idea. While I eagerly await the full vote results to test if this claim holds for the candidates who fell just short of being elected, I think the current preliminary evidence is strong enough to remind us of the limits of exit polls even in theory-- ignoring all the practical problems that also make them less perfect than theory would allow.

Links: See Matthew Shugart's discussion of these problems from a different perspective at Fruits and Votes, and Mark Blumenthal's take at MysteryPollster.

Thursday, January 26, 2006

Hamas claims majority, no official vote count yet

The morning news was dramatically different from last night's take on the Palestinian Legislative Council elections. Hamas has claimed a majority of seats, and the Fatah government has resigned, seemingly in agreement with that assessment of the vote.

However, no official count of votes has yet been released. A preliminary count is expected at 19:00 Ramallah time Thursday (11:00 CST). The Central Election Commission released this statement on its web site Thursday morning:

The Central Elections Commission refutes claims of having released the Preliminary results of the Palestinian Legislative Elections

26/1/2006

The Central Elections Commission wishes to confirm that it has not yet released preliminary elections results. The CEC will officially declare the preliminary results at a press conference likely to be held tonight at 7 pm at its Media Center based at the Ramallah Cultural Palace.

The CEC emphasizes that it is not responsible for any results appearing in the media until after its own announcement of the results and confirms that it has not made any declarations of the results to any of the news media in this respect. The CEC is not associated in any way with statements made in the press or with the public opinion polls published by various parties.

In addition the CEC calls upon the media to regularly check its website for details relating to the results or to the details of its press conferences.


So this is a bit of a puzzle. Of course it is quite likely that both Hamas and Fatah have knowledge of the preliminary counts, so I doubt that we'll see a sudden reversal of this this result. Still... more data would be better and more transparent.

Exit pollsters were said to be puzzled at the discrepancy between their results and the claim of a Hamas majority (where have we heard this before?):


Pollsters stumped by Hamas victory

Palestinian pollsters were at a loss Thursday to explain their failure to predict the Islamic Hamas' resounding victory in legislative elections.

Exit polls on the night of the vote gave the ruling Fatah Party a slight victory, a finding that was dramatically reversed on Thursday when Fatah and Hamas leaders said Hamas had won a clear majority of the 132-seat legislature.

The discrepancy may have been due to a reluctance by some voters to admit to pollsters that they were abandoning the ruling party. The polling errors appeared especially glaring in district races, where smaller numbers of voters were surveyed.


That last sentence may be the most telling. The problem of estimating winners in multimember districts with from one to nine members (averaging 4.1) is a daunting problem for any exit poll, even ignoring any response bias problems. (This point was cogently made by Matthew Shugart last night (in advance!). See his comments at Fruits and Votes here.) We'll need the district level vote data to know how close these district races were-- my guess is that many were way too close to possibly be called by an exit poll at the district level (where the margin of error would be quite substantial.) But until the CEC releases the preliminary counts, we can't do more than speculate about this. (Plus we don't have access to exit poll results at the district level, at least not yet.)

What will be telling is if the exit polls estimates of the party list shares for Hamas and Fatah were close to right but the district level results were poorly estimated. That might also reflect a political reality about candidate selection. Journalist Khaled Abu Toameh has written in the Jerusalem Post that Hamas did a much better job of candidate selection for the district slates-- recruiting respected professionals from the communities, while Fatah's slate was less appealing. If true, that could have produced a shift in results between the party list and the district outcomes. The evidence for that would be better performance by Hamas in the district votes than in the national list in the same district. That data should be available when the preliminary data are released in the next few hours (if the CEC's tentative release time is correct.)

So no graphs on this post, but many more to come as the data arrive. (With some delay on my part for a visit to the dentist!)

And of course there is the tremendous political difficulty for Israel, the US and the EU in dealing with a Hamas government. There will be tremendous pressure for each of these to deal with a democratically elected government, regardless of its origins. It is also a time for decision by Hamas as to what its governmental role will be. Without a minority or a coalition position, a Hamas government will have to take full responsibility for its policy and position vis a vis Israel. An opportunity and a risk for all the players.

Wednesday, January 25, 2006

Palestinian Exit Poll Votes and Seats Estimates


(Click on the figure for a larger image.)

There were three exit polls done for the Palestinian Legislative Council elections on January 25th, one by the Development Studies Programme at Bir Zeit University, another by the Palestinian Center for Policy and Survey Research (PSR) and the third poll was done by An-Najah University in Nablus.

The results for the party list ballot were:

DSP/Bir Zeit: Fatah 46.4%, Hamas 39.5%
PSR: Fatah 42%, Hamas 35%
An-Najah: Fatah 46%, Hamas 40%

Both DSP and PSR have posted reports of their results to their websites. PSR has produced two, somewhat contradictory, sets of results. They offer a summary paragraph of results (which I call "PSR-Projection" in the graph above) and a detailed list of estimated results (which I call "PSR-Data" above. DSP has produced a PowerPoint summary of their results. So far, I have not been able to find a detailed set of results for the An-Najah exit poll, so I can say nothing more about it here.

The graph above presents the estimates from the DSP and PSR exit polls, separating the PSR "Projections" and "Data". Estimates of Hamas seats range from 46 to 58. Estimates of Fatah seats range from 58 to 63. These estimates combine the national party list allocation of 66 seats by proportional representation with the 66 multi-member district seats, for a total of 132 seats.

The "PSR-Data" estimates that Fatah will win 28 PR seats plus 31 district seats, for a total of 59. Hamas is estimated to get 23 PR and 23 districts seats, for a total of 46. In the PSR calculations, 8 seats remain undecided and 4 district seats have been won by independents. Other parties control a total of 9-10 seats in this estimate.

There are some problems with the "PSR-Data" estimates, however. They total only 127 seats, leaving 5 seats unaccounted for.

The summary paragraph in PSR's web page, which I call "PSR-Projection", manages to total 132 seats, but has some mystery of its own. The "PSR-Projection" has Fatah winning 58 seats (one less than their "data" suggest), and Hamas winning 53, an unaccounted for gain of 7 seats from the "data". There are still 8 seats undecided in this calculation, but the five missing seats plus one previously awarded to Fatah appear to have been shifted to Hamas, plus one more from a small party (apparently "The Alternative"). There may be a good reason for these shifts, but it is not explained on the PSR website as of 23:03 CST (7:03 Thursday Ramallah time).

The DSP estimates, on the other hand, leave no ambiguity. DSP estimates Fatah winning 63 seats, and Hamas 58. Independents win two district seats, and four small parties share 9 seats.

And so, we have a range of estimated seats as well as votes. And some irony. While PSR is less than clear about its calculations that don't quite add up, DSP is apparently absolutely certain of its seat distribution. DSP leaves no seats undecided and does not suggest a range of possible outcomes for any party. Consistency is very nice, but an apparent lack of uncertainty is less convincing in its own way than PSR's inconsistency that at least partially acknowledges uncertainty of some outcomes.

Hence the graph above presents all three estimates. That directly reminds us that none of these estimates are certain and that the variability is large enough to be politically significant. Based on these estimates, it seems unlikely that Fatah will command a majority of seats. Whether they can form a majority coalition is unclear to me, as it depends on the choices of the smaller parties and the independents (not to mention the undecided seats.) What does seem justified to conclude is that Fatah has fallen short of its bid for a majority and that this will have ramifications for whichever government forms.

One other important finding from the DSP exit poll: 71% of voters thought the election was fair, 26 percent thought it was somewhat fair and only 3.5% said it was unfair. I take that as a good sign for the legitimacy of the election regardless of the final seat distribution.

And a comment on the exit polls themselves. In the US we don't have the luxury of comparing three exit polls anymore. Cost constraints have pushed the major news organizations to create the National Election Pool which conducts a single exit poll for all news media to feed from. So it is especially satisfying that the Palestinians have managed to conduct three (3!) exit polls under conditions that are infinitely more trying and with resources which are orders of magnitude less than what the NEP has to work with. I'm sure that there are problems with the DSP, PSR and An-Najah polls as with any exit poll, and we've seen here their variability and the problems of inconsistency (PSR) and too much certainty (DSP). But I'd like to take my hat off for a moment to appreciate the enormous effort that these three survey organizations have taken to provide scientific and (I believe) unbiased estimates of the outcomes of these crucial elections.
For all the problems the Palestinians face, I think these three organizations are a tribute to the effort to build and support democratic institutions. We should all be grateful for that effort.

Fatah and Hamas Seats in Palestinian Election


(Click on the graph for an enlarged, and more legible, view.)

The Palestinian Legislative Council elections apportion 66 seats by proportional representation, based on party lists, and 66 seats through multi-member districts (averaging about 4 members per district). The graph plots the seats won by Fatah and Hamas in the districts, based on the Palestinian Center for Policy and Survey Research exit poll. DO NOTE that these are exit poll estimates and subject to change. There are 8 undecided seats and 4 independents in the PCPSR tally that are not reflected in the graph. That matters the most for Jerusalem which has six seats, five of which are undecided. Hebron has three undecided seats. Independents won three seats in Gaza and one in Tulkarm. AGAIN REMEMBER THESE ARE EXIT PROJECTIONS NOT FINAL VOTES!

Turnout up in Palestinian Legislative Elections


More voters went to the polls, especially in Gaza, for the Palestinian Legislative Council elections on January 25th compared to the 2005 presidential elections. Turnout was up in almost all districts, but the consistent increase in turnout in the Gaza region suggests that Hamas may benefit from the extra turnout. Hamas has done better in preelection polling in Gaza than it has in the West Bank region. Official election results are not expected before as late as Friday. Exit polls initially suggested a small Fatah lead, but the details of the exit polls have not yet been released (as of this post.)

The data above are also preliminary-- voting was extended in East Jerusalem and voters in line were allowed to vote after poll closing in many locations. The data point for Jerusalem combines reported votes in both East Jerusalem and the Jerusalem suburbs for the 2006 election.

While Gaza experienced the most visible increase in turnout, the turnout rate was not especially related to the number of registered voters, as can be seen in the figure below.


The largest district, Hebron, actually experienced the lowest percentage voter turnout (other than Jerusalem), though its size still makes it the largest total vote of any district (as seen in the top graph). The highest percentage turnout was in Rafah and North Gaza, both above 85%. Turnout among the Security Forces, who voted over the weekend was the highest of all at 92%. Most other regions turned out between 75% and 85% of their registered voters.

The Jerusalem suburbs are notable for low turnout. Likewise, turnout figures are not available for East Jerusalem which lacks voter registration statistics. Unlike the top figure, here the Jerusalem suburbs stand alone in this figure. Because no registration is available for East Jerusalem no turnout percentage can be calculated. The current counted turnout there is 15,306 as of the 10:00 P.M. report of the Palestinian Central Elections Commission. The data can be found here. They also have a nice turnout map here.

Of course the real question is how many votes Fatah and Hamas got, and more importantly, how many seats each won. Currently estimates are varying across time and across source. Preliminary counts of votes should be available Thursday with official tallies waiting until Friday. And we are still waiting for those exit poll numbers!

Update 17:48 CST/1:48 Thursday Ramallah time:

The Palestinian Center for Policy and Survey Research (PCPSR) has now posted its exit poll estimates here. Their estimate is Hamas 35% of the vote with 23 seats and Fatah 42% of the vote with 28 seats. Other parties take 9-10 seats with 15% of the vote. This is for the party list, based on proportional representation.

In the multi-member districts (thanks to Matthew Shugart for correcting my earlier error), the PCPSR tally stands at 31 seats for Fatah, 23 seats for Hamas, 8 seats undecided and 4 independents.

That would give Fatah 59 seats, Hamas 46, other parties and independents 13-14 and 8 still undecided. (The PCPSR web page gets this as Fatah 58, Hamas 53, but I can't get their table to add up to that count. I'll have to puzzle over this to see why we don't get the same numbers based on their results table. See for yourself here.)

Remember these are exit poll estimates! View these, and all exit polls, with suitable caution and circumspection.

I'll post separately on the exit results that are now available.

Tuesday, January 24, 2006

Canadian Election Outcome, 1/23/2006


The Canadian polls did a good job in estimating the vote for the January 23 election. The estimated vote was within a percentage point or so for the Conservative, BQ, NDP and Greens, and within about 3 points of the Liberal vote, which the polls underestimated. (Green results added, 13:00 CST)

The deviations between the polls and the actual vote are shown in the figure below.


The figure plots the poll minus the vote. Positive errors mean the poll overestimated the vote, negative means the poll underestimated the vote. I use the 23 polls taken in the last week of the campaign, with interviews ending on or after January 15. From the trend figure above, it is clear that during this period there was very little trend in the last week which would complicate this measure of polling errors. In the error figure, the solid vertical line marks the median poll error while the dashed line marks the error of the final local regression estimate, plotted in the top figure. For the Conservative party, these two exactly overlap so only the solid line appears in the figure.

The median poll errors were Conservative +0.75, Liberal -3.02, NDP +0.51, BQ +0.52 and Green +0.51.

For the local regression estimate, the errors are Conservative +0.75, Liberal -2.42, NDP +0.88, BQ +0.27 and Green +1.33.

The local estimator was closer to the outcome than the median poll for the Liberals and BQ, the same for the Conservatives and further from the outcome for the NDP and Greens.

Only the Liberal vote was substantially underestimated, by -3% for the median poll and by -2.4% by the local estimator. Given the sampling error for most polls, this is a credible performance even with the Liberal vote.

The 5th, 25th, 75th and 95th percentiles for the poll errors are as follows:

Conservative: -0.43, 0.70, 1.75, 4.65
Liberal: -5.12, -3.22, -1.22, 0.68
NDP: -1.39, -0.49, 1.51, 2.47
BQ: -0.48, 0.52, 0.82, 1.52
Green: -0.49, 0.01, 1.51, 2.46

The second part of the story is the translation of votes into seats. Like all single-member district systems, Canada's electoral system tends to over-represent the largest parties and under-represent smaller parties in parliament. What is exceptional about Canada is a history of regional parties that win relatively small shares of the national vote, but win a larger share of seats based on strength within a single region. The Bloc Québécois is the current example of this phenomenon. The 2006 election results followed the historical pattern rather well.


Votes and Seats in Canadian elections. The gray line is a local regression fit of past results as serves as an estimate of the seats we would expect given votes based on the history of outcomes since 1867.

The Conservative party seat share is very close to what history would predict based on their vote share. The Liberals did slightly better than the historical pattern, while the NDP fell slightly below the already disadvantaged seat share that the past predicts. The Greens show the typical fate of small parties with no regional strength: no seats despite 4.5% of the vote. The Bloc Québécois stands out as a clear example of the regional party advantage, doing better than expected based on national vote share alone, though in a cluster with previous outcomes for regional parties.

For more on the votes-seats relationship, see the discussion by Matthew Shugart at Fruits and Votes. Shugart is the expert on this topic. I'm just a dabbler in the votes and seats world.

Monday, January 23, 2006

Approval stabilizes, with variation across pollsters


Presidential job approval, July 2005-January 2006. The gray line is the local regression estimate of approval of President Bush. The red lines show the raw data for each pollster during this period. The tendency of the red lines to fall consistenty above or below the gray approval estimate demonstrates the "house effects" that make some pollsters higher or lower on approval ratings.

Approval of President Bush appears to be in a holding pattern. Approval ratings rose through November and early December but have flattened out since mid-December. The current local trend estimate is that approval is holding at 42%.

In an earlier post here, I noted that if you pushed the data hard, you could see a small downturn from a high of approval in mid-December to early January. With more polling now available, I think stability is a more reasonable story. It is still possible to find a 2% downturn from mid-December, but I think that is sensitive to a couple of high approval ratings (also discussed elsewhere here and here). With the data now available, I think flat approval since mid-December is probably the most reasonable conclusion.

A number of polls have appeared since January 1, ranging from 38%-46% approval. However, when we look at these polls individually, we see that most have registered little change since December. For example, the Pew poll of 1/4-8/06 produced a 38% approval rating, but that was unchanged from their previous poll in December. Other polls have risen or fallen by a couple of points, but when considering the pattern of change across all the polls, the conclusion must be that approval is not currently moving in either direction.

This is interesting because the President had substantially boosted his approval in the six weeks leading up to the Christmas and New Year's holidays. Since that period, the White House has been relatively quiet and much political attention has focues on the Alito hearings and other topics. The upshot has been a surprisingly quiet beginning for 2006 in terms of evaluations of the President.

The State of the Union address at the end of the month may mark the kick-off of the 2006 political season in a way that the Alito hearings have not.

Unless new polls say otherwise.

Sunday, January 15, 2006

Hamas closing on Fatah in Palestinian Elections


Updated with polls through 1/21/06. New comments appear at bottom of original post.

There is another election taking place soon here in the Middle East-- the Palestinian Legislative Council elections, slated for January 25. The most important development in the pre-election polling is that Hamas has been steadily rising in support to the point of a very serious challenge to the rule of Fatah, the late Yassir Arafat's party. Conversations with a variety of politically informed Israelis and Palestinians over the past week stressed Hamas has exploited widely perceived corruption by Fatah to create a seemingly successful election strategy. Hamas appears also to have constructed a candidate list that is heavy with repected and respectable candidates:
Unlike Fatah, Hamas has chosen many university teachers, physicians, pharmacists, lawyers, journalists and accountants as its representatives - a move that is being welcomed by many Palestinians, especially in the Gaza Strip, where the Islamic movement enjoys tremendous popularity.
Hamas has had a strategy of providing social services in addition to terrorist bombers for some time and the local support is in part due to the perception that Hamas is far less corrupt than is the long-ruling Fatah party.

This poses quite a problem for Israel. For American's, think of al-Qaeda running strongly in Canada for a rough analogy. For a different analogy, think of the Irish Republican Army and the critical role that its political wing played in developing (over MANY years) a basis for disarmament. Are you better off with the terrorist in government or shut out completely. Are you better off with a fundamentally corrupt Fatah, which you at least have experience with, or an unknown Hamas that might be a better alternative or might use its governmental power to strengthen its terrorist activites. That doubt has to be increased with comments such as this one from today's Jerusalem Post:

Meanwhile, Hamas leader Mahmoud Zahar announced that his movement would not abandon the armed struggle against Israel or negotiate with any Israeli after, when and if, it wins the elections. He disclosed that a Hamas-controlled cabinet would incorporate Palestinian Authority policemen into armed groups that are fighting against Israel.

...

Addressing a Hamas rally in the southern city of Khan Yunis in the Gaza Strip, Zahar reiterated his movement's opposition to any form of economic and security cooperation with Israel.

"To all those who claim that Hamas has abandoned the resistance option because of its participation in the election, we say that we remain committed to the resistance," he declared.

"Israel is an enemy, not a partner or a friend or a neighbor. We won't negotiate with them and this is our final position. Palestine, all of Palestine, belongs to the Muslims and the Arabs and no one has the right to give up one inch of its land."

Fathi Hamad, a Hamas candidate from the Gaza Strip, said his movement would continue to develop its armed wing, Izzaddin al-Kassam, by recruiting more members and manufacturing more rockets and bombs.

The fiery statements of the Hamas leaders come against a backdrop of reports suggesting that Hamas's victory in the parliamentary elections could have a moderating effect on the movement.

Hamas's decision to run in the elections has been interpreted by some Palestinians as recognition of the Oslo Accords and a sign of the movement's willingness to soften its position toward Israel. Its election campaign pointedly ignores the call for the destruction of Israel and focuses instead on internal issues related to financial corruption and lawlessness.

So, will elections gentle Hamas? Would you welcome terrorists as negotiating partners? Or is a corrupt Fatah so unreliable a negotiating partner that competitive elections might improve both Fatah and Hamas?

Israel permits vote, bans Hamas from ballot

Today (Sunday, January 15) the Israeli cabinet decided to allow Palestinians to vote in East Jerusalem but to ban Hamas, as a terrorist organization, from the ballot. This left Hamas with an interesting and delicate position. Because they are doing so well in the polls, it is to Hamas' interest to go ahead with elections, while for Palestinian Authority Chairman Mahmoud Abbas the Israeli move provided a possible rationale for calling off elections that his Fatah party might lose. Hamas responded rapidly, saying it would not let Israel dictate elections and that the election should continue as scheduled. A good article on this appeared in the Jerusalem Post here.


Updated with polling through 1/15/06:

A new poll "prepared by Dr. Nabil Kukali has been conducted and
published by the Palestinian Center for Public Opinion during the period
from (9 - 15) January 2006". The new results show a modest decline in support for Fatah, from 38.1% to 35.6% since 1/2/06. Hamas has held steady at 26.7%, from 26.6% in the 1/2/06 PCPO poll.

Updated with polling through 1/19/06:

Both Fatah and Hamas bump up in the latest poll. That could be because fewer respondents are undecided, boosting both leading parties, or due to a house effect of the particular polling organization. In either case, Fatah continues to hold a small lead going into next week's election.

Updated with polling through 1/21/06:

The latest polling through January 21 suggest that Fatah continues to hold about a 10% point lead over Hamas a few days before voting on January 25. The two latest polls, both ending interviews on 1/21 show somewhat different estimates of the vote percentage for each party, but similar margins between the two. The Palestinian Center for Public Opinion (PCPO) poll shows Fatah at 39.6% to Hamas' 28.8%, a 10.8% lead for Fatah. An-Najah National University's Opinion Polls and Survey Studies Center poll finds Fatah at 43.6% and Hamas at 34.2%, a 9.4% gap. The PCPO poll found a 3.7% gain for Fatah from their previous poll on January 15. Hamas support grew by 2.1% in that time. The An-Najah University polls showed Fatah gaining 4.3% and Hamas 2.9% between January 6 and January 21 polls.

After a period of narrowing margins, the last several polls suggest some stabilizing of the Fatah and Hamas support around a 10 point Fatah lead. The vote in two days will provide a measure of how well the polls do in such a challenging survey setting.

By the way, the Palestinian polling is very interesting from the technical perspective. It is almost all done face-to-face with a clustered and stratified survey design, using objective selection of respondents within households. The non-participation rate is reported to be quite low. And while I have (perhaps unfortunately) focused on the horserace here, the underlying attitudes that are measured in these surveys show a mass opinion which is considerably more moderate than the more militant public image of leading Palestinian groups. After the election I hope we can return to this topic, and to the challenges of conducting high quality survey research in the Palestinians' circumstances.

P.S. I updated the graph to add a poll I had previously missed, taken 12/31/05 by The Palestinian Center for Policy and Survey Research. It adds a valuable data point that agrees nicely with other polls from that time.

Friday, January 13, 2006

Has Bush approval started to decline again?


Approval of President Bush since July 1, 2005, with a local regression trend line.

My model of presidential approval discussed at length here (among numerous posts) is deliberately conservative in the sense that I don't want it to confound random noise or "blips" with significant trends. As a result, the model is designed to not respond very rapidly to short term changes. That is a virtue in general, since many analyses seize on a single polls and claim a trend (even if it logically requires at least two polls to make a trend.)

However, my approach has its defects, and the most important is that it will, precisely because it is conservative, be slow to spot new trends or changes in existing trends. So this post looks at a riskier approach-- one that is much less conservative, and hence more likely to be wrong and make mistakes, but also one that can spot a change without waiting a month.

The occassion for this is the new Fox poll which for the third poll in a row has approval of President Bush at 42% (since 11/30). With the four new polls from 1/8 and the earlier AP/Ipsos poll, we now have six polls from 2006 and so it seems I should take a closer look at the recent approval polling.

The result is the graph above. The fall decline was clearly reversed after November 11 and the climb appears unimpeded until just before the Christmas holidays (the last poll was 12/22). Between 12/22 and 1/5 there were no polls before the six starting 1/5. But the six recent polls fall mostly below the immediate pre-Chirstmas polling.

When the local regression trend is fit, the result is a clear downturn, with approval falling by 1.5%. from 43% to 41.5%. Thus there is a suggestion in the data that approval has not only slowed its rise (as I discussed here) but has actually started down again.

The caution is that this is not a conservative model. it is, in fact, one that is quite likely to be sensitive to data at the end points and in sparse regions of the data. The gap between 12/22-1/5 is unfortunate in this regard because it makes the estimation more unreliable. Hence this result should be seen as reflecting the current central tendency of the 6 polls taken since the new year began. As an estimate of trend, it is suggestive and perhaps right, but we won't have really sound statistical support for a claim that approval is once more moving lower until a lengthier sequence of polls are available.

Thanks to Robert Chung for pompting me to take this look at the data. He has a very nice display that shows that approval has at least slowed its rise here.

Thursday, January 12, 2006

Is the new Pew poll a negative approval outlier?


Plot of residuals from a linear model of 2005-6 approval of President Bush. Horizontal lines mark the limits of the 95% confidence interval for residuals.

A few weeks ago, I wrote several posts on outliers in survey research. The immediate cause was a 50% approval rating found by the Hotline poll in December. A few days later the ABC/Washington Post poll came in at 47%. However, other polls were generally around only 41-43% at that time. So I looked at how unusual each of these cases was here and here.

But what about low outliers? Democratic leaning analysts are quick to pounce on high outliers that make President Bush appear to be doing surprisingly well, and cry foul-- attributing the result as due to the partisan make up of the poll, its peculiar timing, or some other idiosyncratic cause for the unexpectedly good reading.

When an unexpected low reading comes in, these analysts are somewhat reluctant to question the validity of the new poll. Rather it is taken at face value to represent the actual low standing of the President.

And of course Republican analysts are exactly the same only reversed.

To some extent this represents pure partisan bias. But to some additional extent it represents the assumptions of the individual and his or her expectations-- usually shaped by their environment and the dominant expectations in that group.

Political scientists are no different. We all have our biases, except me of course-- I am purely objective in all things <;-). And we live in an overwhelmingly Democratic environment, as do most faculty. This is all the more reason why political scientists need to consciously consider how these biases of expectation can affect our analysis and the questions we raise. For example, I always code "vote" in a pro-Republican direction. Not because I necessarily root for Republicans, but because the expectation in political science is that variables are coded in a pro-Democratic direction. Perhaps that is because of alphabetical order. Or perhaps it reflects the dominant bias of the profession. By reversing the coding, I force myself to question every result simply because all the coefficients have the opposite sign of "normal" coding. This makes me stop and think, but doesn't change the quantitative implications of the analysis at all. Which is a long way of saying that when the new Pew Center for the People and the Press poll came out this week, I added it to my presidential approval data and ran the models as usual, the results of which appear here.

But as I looked at the data it was obvious that the Pew result was some kind of unusually low reading of President Bush's approval compared to most other polls. My model before the Pew poll arrived was that the President enjoyed (if that is the right word) a 43% approval rating. So a reading of 38% is 5% below what should be expected based on my model. When the Hotline arrived at 50%, that was some 8% above expectations at the time. The ABC/Washington Post poll that also seemed high was 4% above expectations. In both cases, they were unexpected enough to deserve some examination, or at least a blog post.

And so, if Pew is now 5% below the expected approval, it deserves to be looked at, and not simply passed over without comment.

The graph above shows the residuals for all polls taken since January 1, 2005 using the linear model I have frequently employed in my analysis, most recently here. The results show that the new Pew poll is a little outside the 95% confidence interval. Over the course of the 175 polls taken prior to the Pew poll, 9 fell outside this interval. That is an empirical rate of .0514 compared to a theoretical rate of .0500. Not bad for social science. With the addition of the Pew poll, this proportion rises to .0568, still not bad agreement with statistical theory. This adds to my confidence that the model of approval is not systematically distorting results in some unexpected way. And it makes the Pew case look like a genuine outlier--- if not a huge one it is at least demonstrably unexpectedly low compared to what our model would predict.

Judged on exactly the same basis as the Hotline and ABC/WP polls, we should clearly discount the impact of the Pew poll in our analysis, at least to some extent.

It is striking that, just like Hotline and ABC/WP, the Pew polls are NOT generally outside the confidence interval for this model. Of 14 polls Pew has done in the last year, only this one falls outside the confidence interval. I wrote in the earlier posts that it is important to recognize outliers, but it is also important to distinguish between polls that are generally defective in some way, and polls that are perfectly well done according the the professional standards of polling, but which once in a while will produce an unexpected result. This is in fact guaranteed by statistical theory: the most perfectly designed and conducted poll imaginable will produce 1 outlier in 20 polls, on average. This is not to say we should ignore outliers-- quite the contrary. It is to say that we should look for, confirm and understand outliers and we should accept that these things happen (about 5% of the time.)

But there is one additional feature of the graph that pushed me to do another analysis. Only one Pew poll residual falls above the zero line in the residuals. This means that Pew polling, on average, registers somewhat lower approval of President Bush than does the "average" poll. This is not necessarily a point of concern. "House" effects are very common in polling. Different practices, different sampling, different interviewer training, different questionnairs and other things can create systematic and consistent tendencies for particular polls to average higher or lower approval ratings. For example, Gallup and ABC/WP produce results that are generally a little higher than the average result. The figure shows that Pew has the opposite house effect, one that is somewhat negative.

It is worth pausing to note that we can NEVER know which of these is truly correct and which is a house effect. Perhaps Gallup is biased (in the technical sense) upward in favor of the President. But it is just as reasonable that Gallup has it exactly right and other polls are generally biased (in the technical sense) downward. Unlike votes, we do not have a standard of truth to compare approval polls to.

I often take house effects into account when modelling presidential approval. I chose not to in the earlier Hotline and ABC/WP poll analyses because I wanted to include the house effects in the UNCERTAINTY about where approval really is, rather than statistically take it out. If we really don't know which house is right, then letting that variation add to our uncertainty about approval seemed (and seems) to me to be the right approach when assessing unexpectedly large or small outliers.

But there is some reason to wonder if the results here are simply because Pew has a house effect that is contributing to its interpretation here as an outlier. Likewise, perhaps I branded Hotline and ABC/WP polls as outliers in the earlier posts when their house effects could be confounding the case.

So I reestimate here a model that allows for house effects. The result of the estimation is that Pew has, over the past year, produced approval ratings that are expected to fall -3.70% below the readings of the ABC/WP poll, and -3.67% below the Hotline. Gallup, by comparison falls -.223% below ABC/WP and +3.48% above Pew. Again I stress that these are normal house effects and we should recognize this as a source of variation in our measurement of approval, but not use it to choose "good" and "bad" polls.


So what happens when we take house effects into account? The figure above presents the results. The new Pew poll is no longer an outlier, but has moved comfortably within the 95% confidence region. This is obviously sensible: if Pew has a house effect of -3.7%, and the new poll was -5% below the expected approval, then -5--3.7=-1.3% below the expectation based on the model. A residual of -1.3% is well within the range of random variation.

In contrast to Pew, the December Hotline and ABC/WP polls remain outliers even after house effects are taken into account. So whatever role house effects play, they don't account for those two polls.

But the Pew polls are now adjusted up to account for the house effect and produce a new outlier, this time one that is too high, compared to expectations at the time. That July poll was unusally high compared to other Pew polls, and the expectation at the time. When we account for the house effect, the high rating relative to other Pew polls becomes a high outlier compared to the model and all other polls.

So with or without the house effect adjustment, Pew has one outlier in 14 polls. Not quite 1/20 but for a small number of polls not a particularly surprising result. It just depends how you treat house effects for which poll is the outlier.

The evidence is clear that the current Pew poll is unexpectedly low compared to other polling that estimates about 43% approval. That seems in whole or in part due to the house effect of Pew polling. Still, I think we want to retain the uncertainty due to house effects in our models, rather than remove it via house effect estimates in this case. (Much of the time I DO think we should take out house effects, but that is a story for another day.) By that standard, the new Pew poll should be discounted somewhat, and we should continue to estimate an approval rate of about 43%.

Tuesday, January 10, 2006

Kadima support holds after 2nd Sharon stroke Updated as of 1/19/06


Updated for polls through 1/19/06. New comments appear at the bottom of this post.

The Kadima party has so far survived Prime Minister Ariel Sharon's very serious second stroke. In five polls taken since Sharon was hospitalized on January 4, Kadima has continued to poll at its previous levels of support. Three of these polls were taken the day after Sharon's stroke, but the latest two were taken 1/8 and 1/9, after the Israeli public had some time to reflect on the implications of Kadima without Sharon.

Israeli press reports of these polls frequently include the expectation that Kadima support will fall in Sharon's absence, as we would expect for a party built around a single person. Pro-Kadima commentators have pointed to the importance of "the program, not the person" but such arguments have been significantly dismissed by polling experts and even Kadima insiders. See, for example, this article in Haaretz on 1/11.

Senior Kadima officials, however, believe that these results still reflect the popular identification with and support for Sharon, and that some of the respondents are transfering their support and affection for the prime minister to his replacement and his party, despite being aware that Sharon will not return to lead it.

Sharon's aides - who are now working with Olmert - believe that these positive results for Kadima and Olmert will not last for long. They do say, however, that if they can avoid missteps and meld Olmert and Sharon into "Sharon's Path," then "chances are good that Kadima will end up as the biggest party after the election, and Olmert will be asked to form the next government."

But PoliticalArithmetik is about data, and so far the polling is not reflecting this expected fall in support. With less than a week since Sharon's illness, and with his life hanging by a slender thread, it is certainly possible that this "transfer of affection" will be short lived and begin to fade as security issues become more important. But for the moment, let's consider the data. The expected fall for Kadima has not yet appeared. More important, no rise in support for Likud has made itself visible in the new polls either. Is it barely possible that an Israeli public in which support for a "two state solution" remains strong, will in fact adopt the party under Acting Prime Minister Ehud Olmert, making Kadima in fact a party of "program, not personality"?

At this time, the campaigns of the parties are on hold, waiting for the outcome of Sharon's hospitalization. That hold cannot last very long, however, with the March 28 election approaching and Kadima in need of formal leadership and a candidate list. Once the parties begin the campaign in earnest, these polls may rapidly change. For now, however, I find the steady support for Kadima both surprising and intriguing.

Update: Polls through 1/11/06

Another new poll out today, for a total of three this week, continues to show stable support for Kadima (and the other parties as well.) Opinion of experts in Israel (where I am right now) seems to be divided. Yesterday I had several conversations with political scientists and other close observers of politics here that supported the view that Kadima's policy (Sharon's policy) has widespread backing and that the Kadima vote may stay because supporters may have trusted Sharon to carry it out, but they think Kadima may as well and there is no good alternative party that would offer the same policy. Today, on the other hand, I encountered some equally distinguished students of Israeli politics and parties who took the opposite view and suggested that the outcome will converge to some rough equality among the top three parties. They too had good reasons to support their prediction.

So I'm going to remain very modest in making any forecasts here. My job is to show you the data and put it in context with other data and with data over time. I certainly don't know what will happen next. But what I do know, and what the data above show quite strongly is that so far support for the parties has not changed in any significant degree. It is a long while until March 28, so the track of the polls across the right half of the figure (the blank part) is the story yet to be written by the parties, leaders and public in Israel. Stay tuned.

Updated for polls through 1/12/06:

The very surprising strength of Kadima remains, and indeed, if anything support for Kadima has risen over the past week. In contrast, Labor continues its decline and Likud seems to be flat.

A surprising development today was that Shinui party essentially fell apart, with it's leader Tommy Lapid threatening to quit the party after the man he called his partner in the party, Avraham Poraz, was denied the number 2 spot on the party list. Following the loss, Poraz and four other current MKs pulled out the primary election and announced they would not be candidates for Kadima (at any spot on the list). Lapid failed to win support for Poraz and left the party convention following the loss.

Shinui is polling at only 3 or 4 seats, a dramatic collapse from the 15 seats it currently holds in the Knesset. As the strongest "secular" party, Shinui's virtual absence from the new Knesset will be felt in whatever coalition negotiations are necessary for the formation of a government. If Kadima does as well as it is currently polling, it would need coaltion partners, and those have come from the religious parties joining Likud in recent years. If Kadima needs the support of one or more small parties, the absence of Kadima makes it more necessary to turn to the religious parties for support.

Updated for polls through 1/18/06:

The collapse of Shinui is the most obvious change in three new polls, conducted 1/18/06, after the Labor primaries but before the 1/19/06 suicide bombing in Tel Aviv. Shinui, which fractured badly over the selection of its list of candidates, has now reached zero projected seats based on polling. Unless a surprising reversal of fortune occurs, this appears to be the end of the centrist and secular party that was the third largest block in the current Knesset. While Kadima is set to take over some of Shinui's center role, it is unlikely to also adopt the strongly secular views of Shinui.

In the latest polls, Kadima continues a strong performance, with between 37 and 43 seats. The estimated trend for Kadima remains positive since Prime Minister Ariel Sharon' s strokes. (Individual polls differ in the trend for Kadima and other parties, with some seeing decline since the last poll by the same organization, while others find stability or a rise. I am using the trend across all polling to characterize Kadima's standing as still slightly rising, and likewise for other parties.) Meanwhile, labor has continued to decline, though the latest polls are above the trend line. Likud seems to be holding steady in recent polls. The religious Shas party continues to command support for 10 mandates. The Arab parties also continue to hold a total of 8 seats.

The remaining small parties have shown no measurable movement, polling between 3 and 6 seats each.

Terrorist bombings have moved public opinion and electoral support in the past. The bombing in Tel Aviv today (1/19) is the firs since December. All polls in this figure were taken before that event. New data will reveal whether there is an impact on public support for the parties.

Updated with poll on 1/19/06:

In a poll taken the same day as the Tel Aviv bombing, no changes in support for the parties.

Bush approval gain rate slows UPDATED 1/8/06


Updated to include all four polls taken 1/8/06. Updated comments follow the original post.

Approval of President Bush took a sharp upturn after November 11. Since that time approval has gained some 6%, from 37% to 43%. With no polls taken over the Christmas and New Year's hollidays, it has been hard to assess how strong this rebound has been since mid-December. The appearance of three new 2006 polls has given us a little better handle on this, though it will still take another half-dozen polls to have a good sense of the path approval is taking in the new year.

In the graph above, the November-December surge is clear. The blue line represents my regression model of approval, while the green line is a local regression (lowess) fit. The two track quite well, so for now I am using the linear model for analysis. However, if the local fit uses less data to fit the trend, it shows a leveling out of approval since mid-December. That estimate is very fragile, however, because it rests on few data points and those are at the end of the trend, a point that is always hard to estimate.

To ask if the upward gain has been slowing or remained steady since December 1, I took a different approach. I fit the linear model for polls available as of each day since December 1. Each day that a new poll appears is added to the data at that point. This allows me to estimate the "gain rate" for the President, and see how it depends on which polls are included in the data at that point. If this gain rate remains stable throughout the 40 days since December 1, then this is evidence that the President's rebound is solid and continuing. If the gain rate slows, then this suggests that approval is stabilizing in the latter part of this period, and no longer increasing as fast as in November and early December.

The "gain rate" is the expected gain in approval percentage PER DAY. A rate of .10 means a .1% increase per day, or 1% over 10 days.

One possible complication is the Hotline poll from mid-December which produced an exceptionally high approval rating of 50%. I've discussed this poll at length here. When that poll enters the data, it causes an sharp increase in the estimated gain rate, as does the ABC/Washington Post poll a few days later. However, as more polls have come in, this influence becomes much less, so that by the polling of 1/8/06, the estimated gain rate is virtually identical with or without the Hotline poll. For that reason I've included the Hotline in the graph below.

Flat parts of the graph are days on which no new polls appeared so the estimated gain rate is constant in the absence of new polls.


This graph makes clear that the estimated gain rate has in fact slowed throughout the month of December and early January polls. It remains postiive, showing that approval of President Bush remains on the upturn, but that rate of increase has now fallen from .25% per day (a 1% gain every 4 days) to just under .10% per day (a 1% gain every 10 days.) That decline is important and raises the question of whether the initial impact of the White House's new assertiveness in November has now been spent, or if new issues, such as the NSA warrentless call monitoring has had an effect. Before chalking this up to politics, it is also possible that the holidays simply reduced the public's attention as well as dampening the "input" of the political signals as well.

In any case, there is good evidence here that the gain rate has slowed. New data in January will be needed to clarify what the trajectory will be in early 2006.

Updated 1/12/06.

Thanks to Mystery Pollster here for tipping me off to these new polls here and here. I'm out of town and hadn't had time to find them on my own. MP has an excellent discussion of these which agrees in part but offers some smart points that aren't constrained by the methodology I use here. Do check out his points.

Four polls have now been released that all ended on 1/8/06. I've updated the graphs to include two of these that were not available at the time of the original post. The importance of these is that they include an ABC/WP poll that previously had found an unusually high rating of the President. That rating fell in the ABC/WP January poll, but by only 1 point, from 47% to 46% approval. This relatively high rating might be expected to raise the gain rate estimate above my previous one of about .10% per day.

At the same time, the Pew Center for People and the Press poll was taken, yet it produced and estimate of only 38% approval, exactly the same as in their last poll. Such a low estimate might also be expected to change my estimates of the gain rate, but in this case to make it even lower.

New Gallup and CBS/NYT polls also appeared, with CBS finding a 1 point gain from 40% to 41% since December, while Gallup found not change at all, at 43%.

Updating my estimates of the gain rate resulted in no significant change from my original estimate. The estimated value is .0987% per day, or about .10% per day. While it matters which polls you include in this estimate, the second figure above shows that it doesn't matter much. The four colored dots show the estimated gain rate if we EXCLUDE each of the new polls in turn. The result is some variation in the precise estimated value, but all remain pretty close of .10% per month. These four estimates all fall WELL within the 90% confidence region of the overall estimate as well.

So I conclude that the gain rate estimate is not especially sensitive to the mix of latest polls. All lead to the same qualitative conclusion: The gain rate is .10, or a gain of 1% in approval each 10 days.

What is STILL not answerable from these data is whether the declining gain rate we have found in this analysis has continued to decline, making approval currently flat, or whether it is reduced but still a non-trivial percentage point every week and a half. For that there is no substitute for more data. If you push these data as hard as you possibly can (and beyond the point of wisdom, caution or sanity-- I'm talking about with my methods, not criticizing MysteryPollster!) then the last handfull of polls do indeed look like approval has now stabilized at 43% and hasn't been gaining at all in recent days. But that would be a fool hardy prediction based on the limited data, so I would not make that conclusion yet. I think the rather strong evidence we DO have here is that the approval gain that was a quite high .25% per day when the White House launched it's public opinion offensive on November 11 has declined to a still positive but much smaller .10% per day. I am satisfied with that strong analysis and am willing to wait for equally strong analysis about what has been happening after New Years.

Sunday, January 01, 2006

Canadian election update (as of 1/22/06)


Now UPDATED with polling completed through January 22, 2006. Newer comments appear at the bottom of this original post.

Canada will hold federal elections on Monday, January 23. Liberal party Prime Minister Paul Martin disolved parliament on November 29, setting off the election campaign. Among other issues, this election will offer the public a vote on the Liberal party's handling of the "Sponsorship Scandal" which has dogged the Liberal government for over two years. On November 1, 2005, Mr. Justice John Gomery released his report on the scandal. Prime Minister Martin had pomised in an April 21 speech to call elections within 30 days of the release of that report. For much more detail on the Sponsorship Scandal and the Gomery report, see the coverage at the Globe and Mail here.

The data presented here are taken from the exceptionally good web pages of Nodice.ca here. Their coverage of the election goes well beyond the polling data and is very much worth reading. Meanwhile, I'll focus on the polls.

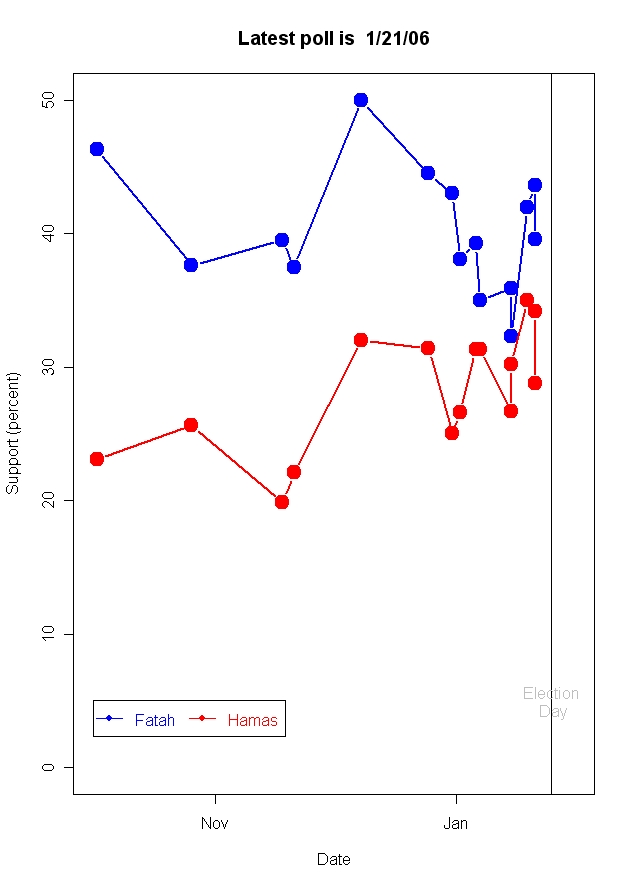
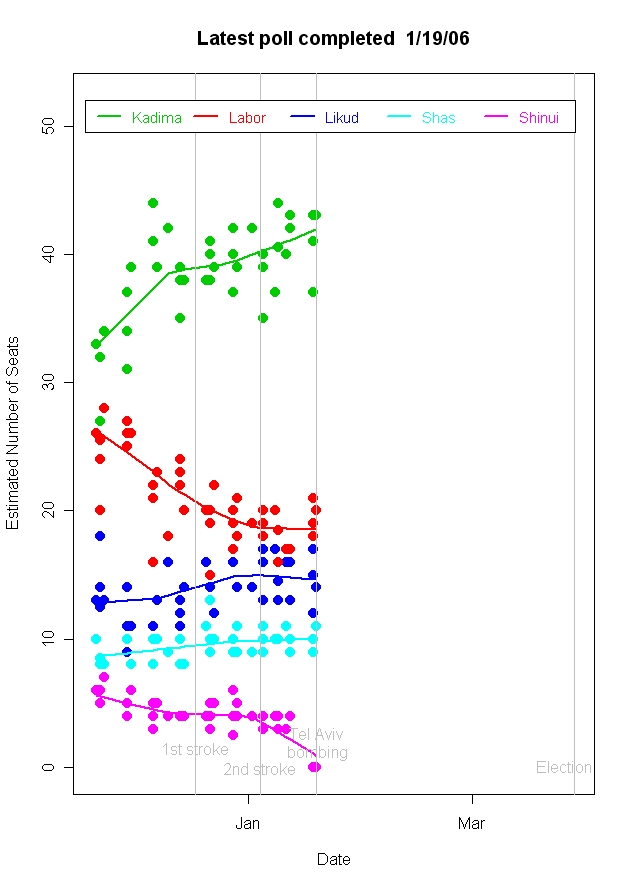
The top panel of the graph above shows the trends in party support since the last federal elections, on June 28, 2004. The sold round points indicate the last election results in popular vote. The open circles are poll results since then and the solid lines are the trends in party support, estimated by a local regression (lowess) fit. Vertical lines are labeled with major events in 2005. Justice Gomery conducted his investigation throughout the spring of 2005. On March 29 he imposed a publication ban on certain testimony, provoking a great deal of press circumlocution. The ban was lifted on April 7, unleashing especially harsh evidence against the conduct of the previous Liberal government. As is apparent from the graph, the result of this news was a 10 point drop in Liberal support while the Conservatives enjoyed a 5 or 6% increase in support. This was short lived, however. Prime Minister Martin gave a speech on April 21 describing his efforts to rectify the scandal, argued for the importance of allowing Justice Gomery's full report to be completed and published, and promising to call new elections within a month of the publication of the report. The Liberal government survived a confidence vote on May 19, by a one vote margin-- with the Speaker breaking a tie.

Following the confidence vote, liberal support settled in a range a few points below its previous equilibrium but considerably higher than during the worst days following the publication ban. Conservative party support sank back to it's earlier equilibrium. This status quo was maintained until the Gomery report was released on November 1, when the Liberals suffered a modest and seemingly short term, downward shock, while the Conservatives picked up a couple of points.

In the campaign period so far, there has largely been stable support for the parties. The first two of four debates were held December 15 (French) and 16 (English) but produced no immediate shocks in the polling. The next two debates are scheduled for January 9 and 10.

Pollsters largely took the Christmas to New Year's holidays off. The latest two polls offer a split view-- one with a Liberal-Conservative gap about equal to the pre-Christmas polls, with the other showing a tightening to a statistically insignificant difference. This should become more clear as polling resumes with the new year.

There is some evidence in the polling that Conservative strength threatens to drive suporters of the National Democratic Party into voting strategically for the Liberals. There is a slight downward trend in the NDP's poll standing, though again a need for more post-holiday polls to be more confident of that trend. The Globe and Mail has an interesting story on this possibility here.

Finally there are large regional variations in support, most obviously for the Bloc Québécois, but not limited to them. We'll take a look at that another time. The polling links at Nodice.ca provide full details for those who can't wait.


Update (1/5/06):

The post-New Year's polls seem to confirm the tentative trend we saw in the last polls of 2005. The Liberal lead has vanished and the Conservatives are at least tied and quite possibly ahead. In the bottom half of the figure above, the trend lines have clearly shifted to favor the Conservatives. This reversal of fortune is striking as the first substantial movement of the campaign. It is also damnably frustrating that it appears to have started during the lull in polling over the Christmas and New Year's holidays, so we have missed the chance to see the move from the beginning.

A technical concern and caution about the above figure is in order, however. The lowess trend lines I present above are sensitive to the last data points in a series, especially when there are relatively few observations and, as in this case, the last few observations are separated from the earlier data (due to the lack of holiday polling.) For these statistical reasons, we should consider the latest trend line to be extremely tentative. It clearly reflects the surge in Conservative support, and the loss of Liberal backers, but the trend cannot be estimated very precisely without more post-New Year's observations. I am sure the pollsters will oblige us with more data shortly.

Update (1/6/06):

Several new polls ending 1/4 have now been added to the data. The Conservative lead now appears to be about 2.5% based on the local trend lines in the figure. There is also some hint that the Liberals' decline may have started to stabilize. Once more, however, we should be cautious about the rate of change with so few January polls.

And one small technical note: the dates I give for polls is the last day the poll interviewed people. Reporting of poll results on the web sometimes gives the date of the publication of the poll, rather than the last polling date. I try to be consistent and only use the date of last interview. This makes the results look "older" but is more properly a reflection of when the polling was done.

Further update (1/6/06):

Just as I posted today's update, I got the new CPAC/SES tracking results for 1/5. They've now been added to the figure. SES finds the surge for the Tories peaked on 1/3 at a 3 point lead, 36-33. Since then their tracking has found a 2 point lead on 1/4 and now a 1 point lead, 34-33 as of polling ending 1/5. In those three days Liberal Party support has been constant at 33%.

The trend lines in the graph above suggest that the Conservative rise has continued, but no other polls completed on 1/5 are yet available to see if others verify the stabilization or even decline of the Conservative lead. My estimate remains at 2.5%, for now. Stay tuned.

P.S. See Matt Shugart's comment here and his posts on the Canadian election at Fruits and Votes here.

UPDATE 1/9/06:

New polls through Jan. 8th make it clear that the surge by the Conservatives and the slide by the Liberals has continued. Last update the Liberals appears to be flattening out, but as of the Jan 8 polling, it is clear that their decline continues. The gap is now about 3.5% in my local trend estimate. Some polls have it as high as 8% or as low as 3%. My trend estimate is an attempt to smooth out the random poll-to-poll variation, hence it is less extreme and a little slower to respond to short term movements.

I'll be out of the U.S. for the next week and may not be able to keep this updated while I'm traveling. In addition to the polling links mentioned above, http://www.canadawebpages.com/pc-polls.asp is very good. Thanks to Mahigan who pointed this out to me in a comment.


Update, through polling as of 1/10/06:

I've just managed to update the election tracks through the 1/10 polling dates. The surge by the Conservative party appears to continue and to grow while the Liberals continue to sink. This is a remarkable run of improving polls for the Tories given what stability we saw in the polling before New Years.

Because I'm in Israel and have a very full schedule of meetings, and a very balky wireless connection (if you stay at the King David hotel in Jerusalem beware the wireless server!) , I've not been able to keep up with the news of the second set of debates, let alone see them. Given the trends here only include data collected through 1/10, these effects ONLY include a small part of the effect of the second round debates. The rolling nature of the sample means only 1/3 of the sample could have been exposed to the third debate and none of the sample to the fourth debate. Therefore these trends are substantially "pre-third-debate" and so give us a very poor reading of the response of the public to these last two debates. What can certainly be said is that the Conservative party came into the debates with all the momentum and a significant lead in the polls. As the story unravels over the next few days of polling we will see the impact of the debates emerge.

I'll still be travelling for a while so updates will remain slower than I would wish. Keep your eye on http://www.canadawebpages.com/pc-polls.asp for a decent graph and up-to-date data in the meanwhile. (But do check back here-- I'll update every chance I get.)

Update, polling through 1/11/06:

The conservative lead remains strong after the final debate. Both the Conservative climb and the Liberal decline appear to continue. One wonders if there is a floor for the Liberals or a ceiling for the Tories. Certainly there is still no evidence of a debate impact, either to spur on the Conservative lead or to provide a rally for the Liberals.

I'll be away from an internet connection until Sunday night, so unless there is an internet cafe in the Golan Heights, I probably won't be updating this for a couple of days.

Update, polling though 1/13/06:

There isn't a lot of dynamics at this point. The Liberal Party's slide looks to have stabilized at 28-29% while the Conservatives are consistently polling at 38-39%, almost exactly the reverse of their support at the start of the campaign and representing a quite dramatic reversal of fortune. One topic I've not been able to look into from the road is the geographic distribution of the vote and how the seats are likely to be distributed. Others have looked at this and it is in the end more important that the popular vote.


Update, polling through 1/14/06:

No visible change since the 1/13 polling. Now updated with both CPAC-SES and Strategic Counsel polls through 1/14. But still not visible change. Both parties seem to have flattened out.

I'll be in the air much of the next 48 hours so will be lucky to have time to post after bedtime tonight, but should be back in the U.S. on Tuesday and will update as promptly as possible through election day.

Update, polling through 1/17/06:

There has been a slight decline in support for the Conservative party, with a corresponding upturn in support for the NDP, over the past three days of polling. After a long period of stability support for the Tories has fallen a little over a percentage point, based on the local regression trend lines in the figure above. Meanwhile the NDP has gained almost two points in support. Support for the Liberal Party, however, appears unchanged.

Update, polling through 1/20/06:

After polling earlier in the week suggested a decline in support for the Conservatives, the last three days of polling suggests more stability in the Conservative lead over the Liberal party. The NDP does appear to have gained a bit this week.

Final pre-election update, polling through 1/22/06:

The last seven days have seen stability in support for Conservatives and Liberals, and a modest rise in support for the NDP. Today (1/23/06) we get to see what the voters have to say, and to measure the accuracy of the polls.

But first, let's back off and take a look at the entire campaign and the perspective of longer term trends. While the basic pattern of support has been stable for 10 days or so, the dramatic story of this election campaign has to be the rise of the Tories and the slump of the Liberals. The two parties have almost exactly reveresed their positions since elections were called on November 29. The shift of fortune by about 7-8% for each party is a substantial amount of change during a campaign. This markes the 2006 election as one of particular interest for understanding campaign dynamics.

The most frustrating aspect of the data is that the shift in party support took place most dramatically during the Christmas-New Year's holidays when little polling took place, and when we might normally think that voters minds are elsewhere. So a period that would be expected to produce little political change (and hence when little polling should be needed) turned out to be precisely the time when substantial numbers of voters changed their minds about the two leading parties. Individual level data from those polls will be necessary to tease out the sequence and possible motivations for change, but the "blank spots" in the graph between December 22 and January 3 will remain frustrating to analysists.

A second way to look at the dynamics is to return focus to the top half of the graph, one that I have ignored for too long. Here the time scale is that of this government. On this scale, the long periods of political stability are marked by two periods of dramatic, though short term, change. The first came in the spring of 2005 during the Gomery investigation of the "Sponsorship scandal". At that point the Liberals slumped suddenly by 10 points, from 40% to 30% support, only to then recover most of their original support following the confidence vote they won by a single vote. The Conservatives saw a smaller rise, but almost immediately lost their gains to fall back to their original support of 28-29%. The two leading parties remained locked at those levels of support up through the dissolution of parliament November 29. But what appears as gradual change in the lower panel of the figure, is revealed to be extremely rapid change in the top panel. After an initial pause, the shifts in party support are even steeper than those during the Gomery investigation last spring.

The impact of the Gomery investigation in the spring was a preview of the vulnerability of the Liberal party. But the puzzle is that when the Liberals barely survived the confidence vote on May 19, their support returned to nearly their pre-investigation levels, as did the Conservative party support. There was only about -2% long term cost to the Liberals, and Tories received no gain at all from the scandal. Yet when the election campaign came, the damage to the Liberals and the strength of the Conservatives came back to produce the dramatic change we see in the top panel. So were the Liberals simply "walking dead" waiting to fall down, or did the Tories find the right issues and campaign themes to destroy the Liberal advantage over the course of about 10 days during the holidays?