Chris Bowers over at MyDD had an interesting bone to pick with my previous post on how low presidential approval can go. Because his point is interesting, and because it has come up before I want to give an extended answer. Chris' point was that focusing on President Bush's "approval" numbers ignores his "disapproval" number. In comparison with past presidents, the current Bush "disapproval" is relatively high-- he is tied for the fourth worst rating since WWII. If we focus (as I do) on approval rating, then he is in the middle of the bunch, bad but not one of the worst. Chris called for putting the "approval" numbers in more context. Amen. Here is some.
The reason I focus on approval is that approval and disapproval are near-mirror images of each other. If every respondent in a survey either approved or disapproved, then the two HAVE to add to 100%, Approve+Disapprove=100. One can't go up without the other going down by an equal amount. Hence there is no added information in looking at disapproval rather than approval. HOWEVER, there are some respondents who say they "Don't Know" enough to evaluate the president's job performance. This allows approval and disapproval to now vary somewhat independently of each other, but the three still have to add to 100%, Approve+Disapprove+Don't Know=100%. When the DK rate is high, there can be a fair amount of independent variation. But when it is low, approve and disapprove must mirror each other quite closely. What I MEANT to say here... approve, disapprove and dk are each exact functions of the other two. For example disapprove = 100-approve-DK. That means that for a given value of approval, disapprove will vary depending on the DK rate. Higher DK means disapprove will be lower for a fixed level of approval. Lower DK means higher disapproval, again for a fixed level of approval. So approve and disapprove are not exact mirrors of each other as DK varies. When DK levels fluctuate substantially the relationship between approve and disapprove is less exact. When DK levels are relatively steady (at any level) then approve and disapprove are closer to exact mirrors of each other. One way for DK to hold steady is for it to assume very low levels, as has largely been the case with G.W. Bush. (Thanks to reader Patrick N. for pointing out that I hadn't said what I meant to say.)
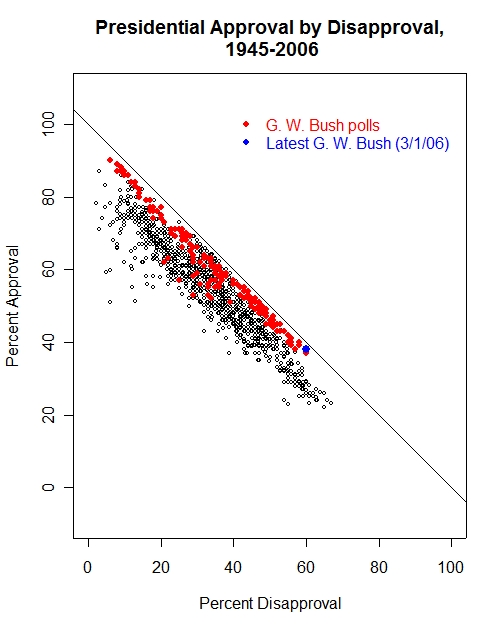
In the figure above, we see that President Bush is near the lowest approval (highest disapproval) rating of his term. (Based on Gallup only so we can compare across presidents.) What is also clear is that his ratings are mostly much closer to the diagonal line in the plot. This line represents the limit of approval-disapproval pairs if DK were equal to zero.
Any point on the line is an approval-disapproval pair that adds to 100%. The figure makes clear that Bush has had much less independence between approval and disapproval because his rate of Don't Know responses is lower than past presidents. Therefore his approval and disapproval mirror each other and using both provides little more information than using the other.
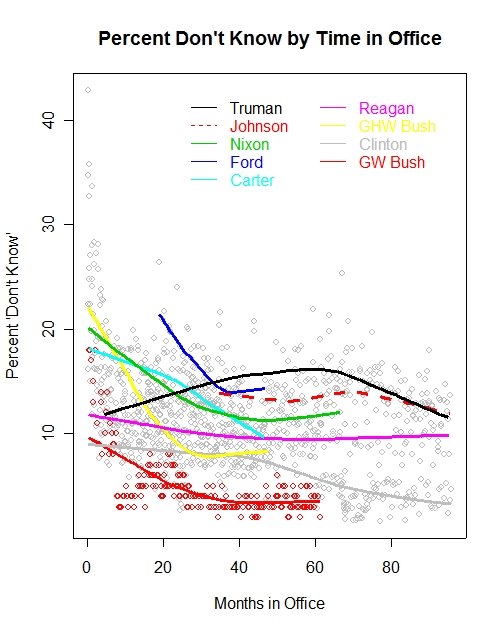
The decrease in "Don't Know" responses over time is striking. The figure below shows the range of DK responses since Truman. The "box" contains 50% of the polls, with the lines extending out to about 95% of the polls. The circles are outliers.

What is striking is that since Reagan, the don't know rate has declined sharply and continuously. Each successive president has averaged lower DK rates than his predecessor. This decline coincides with the increased polarization of electoral (and congressional) politics over the past 25 years. It is tempting to conclude that the more polarized politics has produced a citizenry that is also more willing to evaluate presidential performance and less likely to have no opinion. Unfortunately it could also be due to declining survey response rates. For many variables, a low response rate doesn't necessarily imply a poor measurement of opinion because the reasons for not responding are uncorrelated with opinion. However, in this case it is likely that saying "don't know" is correlated with political engagement, interest and knowledge. All three of those are correlated with willingness to respond to an opinion survey. So the explanation for the decline in don't knows must remain uncertain (at least for the analysis I can do here-- this would be a good term paper for a grad student out there, hint hint.)
Whether for important substantive reasons of greater polarization, or for technical reasons of survey response rates, the don't know rate has declined. That means that Bush's approval and disapproval MUST more nearly mirror each other, and they obviously do in the top figure. It also makes simple comparison with past presidents more difficult. Truman's 65% disapproval came when 13% still said "Don't Know". Bush has rarely been over 5% don't know and is often at 2 or 3%.
We can compare Bush to the presidents who have been in worse shape by either approval or disapproval. The graph below shows them all. While many polls have been below his approval number, a smaller number (though not tiny) have been worse on disapproval. Chris' basic point, which I (and the data) agree with.
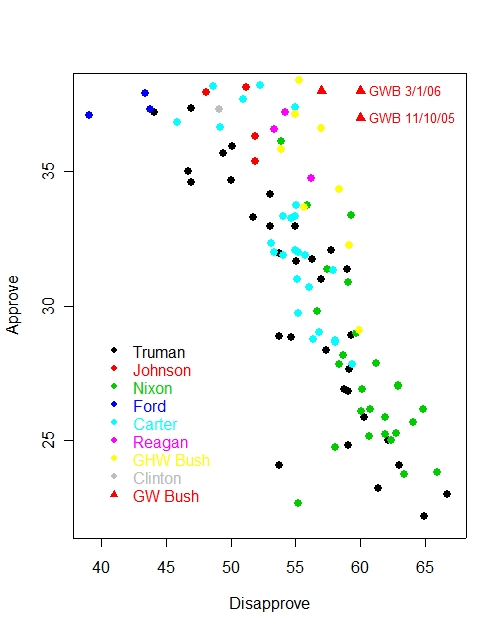
The 60% current disapproval would go with an approval of only 25-30% based on these past presidents, in which case Chris is exactly right that Bush should be seen as much weaker than assessments based only on approval suggest. However, his current 38% approval has in the past mostly gone with DISAPPROVAL rates of about 45-55%, a bit lower than his current rate. Either way his approval ratings are somewhat atypical of previous presidents, and simply picking one or the other or both doesn't account for the changing rate of DK responses.
Rather than tote up a score card to rank President Bush as "4th worst" of merely "6th worst" ratings, I'd look at the first figure here. Now matter how you look at it, being towards the bottom right is bad news for any president. In this case with very few don't know responses, disapproval will go up in lock step as approval goes down. The problem for the White House is how to reverse the movement that has taken this administration from the top left of the figure to the bottom right. There are still 34 months to go for the administration. It can get worse or it can get better. Which will it be?
P.S. The correlation between approval and disapproval has always been quite high after the first year in office. Bush's correlation is even higher, since DK is small. Here is the figure. (The drop in correlation in 2004 is interesting. Both approval and disapproval stayed in a narrower range in 2004 than in other years, which lowered the correlation.)
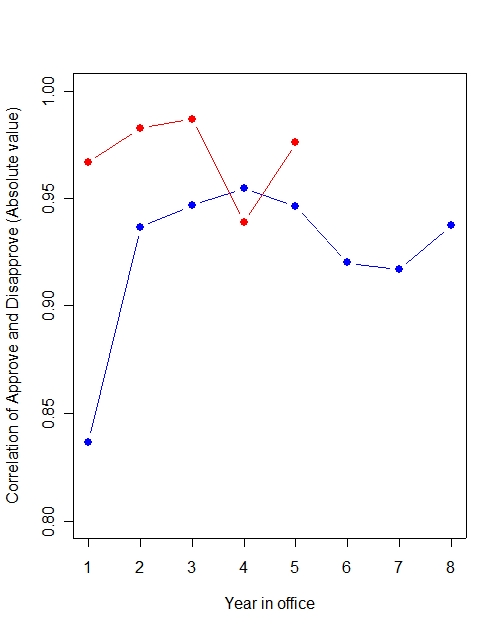
(The actual correlation is, of course, negative. I've plotted absolute value so the graph "goes up" as intuition would say it should.)
Don't knows also fall with time in office, but much more so in recent years. Here are those data: