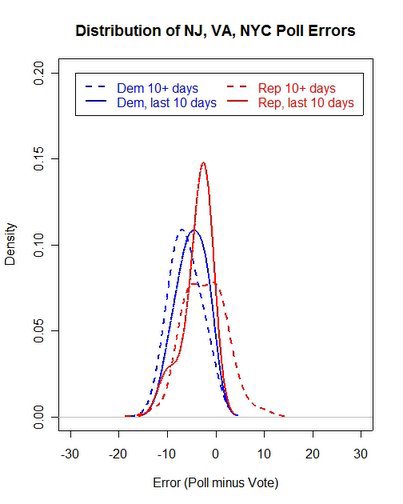
Distribution of polling errors in New Jersey and Virginia Gubernatorial elections, and New York City Mayoral election, November 2005.
As with the California propositions, we can calculate the variability of the errors for the New Jersey and Virginia Gubernatorial and the New York City Mayoral election polls. Again, there is little a priori reason to think the poll performance will differ across these, so I pool over the three elections and all the polls.
The figure above shows the variability of the errors and the shifts in the location of the distributions between early and late polls. For polls taken more than 10 days before the election, the middle 90% of poll errors is -10.70 to -0.67 and -9.04 to -1.65 for polls taken in the last 10 days of the campaign. The medians are -6.65% and -5.19 for early and late polls, a modest improvement but still a substantial underestimate of the final vote.
For the Republican vote, the 90% interval is -7.78 to +4.22 for early polls and -8.53 to -1.86 for the final 10 days. The medians are -2.78 and -2.39 for early and late polls.
These results show a modest decrease in uncertainty in late polls, and small shifts of the median estimates towards the true outcome. However, the median underestimates the Democratic and Republican share of the vote, even in late polls. As with the California proposition polling, these underestimates reflect the failure to allocate the undecided voters in the polls. But this begs the question of how such votes SHOULD be allocated and by whom. We can arbitrarily choose either of the Mosteller suggestions mentioned above: proportional or equal allocation of the undecideds. But the more reasonable method of allocation of undecideds requires access to the raw individual level data, which is not available in general and never before the election.
On the face of it, one might estimate the predicted probability of voting and of voting for each candidate among the undecideds, using the decided voters for the estimation, and from this estimate the final vote prediction. Pollsters are apparently unwilling to do this, preferring to simply report poll percentages rather than make modeling decisions as well. (This seems a reasonable business choice, even if it frustrates election prognosticators.)
The bottom line here is that the empirical margin of error for late polls in these three races is +/- 3.7% for the Democrats and +/- 3.3% for Republicans. Unfortunately, neither of these ranges covers the final vote percentage, so the bias in estimating the voter percentage is larger than the margin of error. Again, without the raw data, we cannot calculate an optimal allocation of undecideds which would reduce the bias estimate. (One can also calculate the “spread” between the candidates, which estimates who is ahead. Those calculations make the polls look a bit better in picking winners, but with still substantial variability, which is my story here, rather than prediction per se.)
