
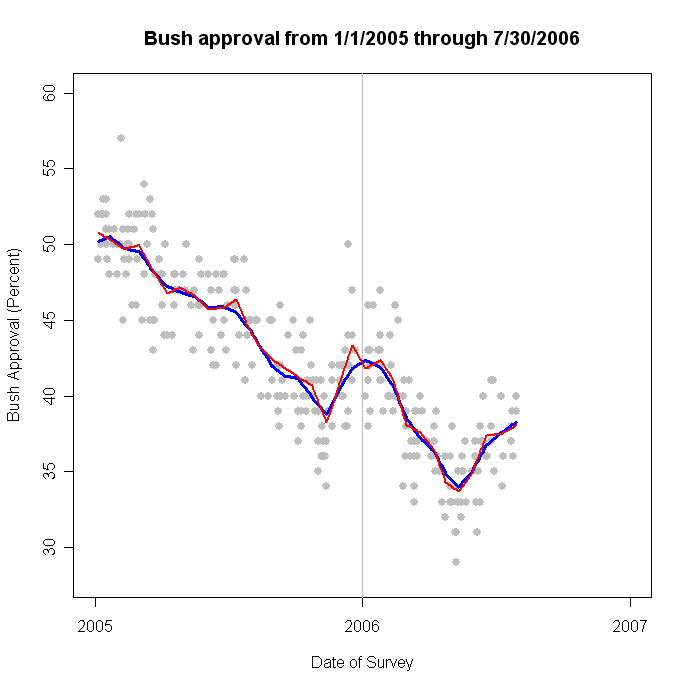
A Gallup poll taken 7/28-30/06 has come in with approval of President Bush at 40%, disapproval at 56%. This is a 3 point uptick from the Gallup poll of a week earlier, which in turn was a 3 point downtick from the poll before that. Gallup points out that none of these recent changes are statistically significant. With the addition of Gallup, the trend estimate of approval (the dark blue line) stands at 38.3%. That's a change from 38% earlier in the day before adding Gallup's result.
Gallup's write-up of the results stresses stability over the past 6 weeks or so. Of course here at PoliticalArithmetik we have a slightly different interpretation. The trend among all polls has continued up since May 15, though the rate of increase slowed in late-June. Gallup is right that the poll-to-poll changes in their samples are not statistically significant but the estimated trend suggests a different story. Gallup's ups and downs of late reflect the random variability from poll to poll. The scatter of gray points around the dark blue trend line in the figure above shows how much variability there is across polls compared to the small but steady upward movement in estimated approval. Gallup tracks this trend quite well, with a small upward bias. (CAREFUL: "Bias" here is a purely statistical term-- it just means the average Gallup is slightly higher than the trend across all polls. It does NOT mean a political bias. Go debate that somewhere else! <;-)) The difference in interpretation is that my trend estimate has shown approval continuing to rise in late June through July. This rate has slowed from what came before, gaining about 1.25 percentage points between June 25 and July 30. Yet that is still upward movement during a time in which we might well conclude that approval was flat. In fact, I said "essentially flat" myself in a post here last week ("Since early July, the standard blue trend line has remained on a very slight upward path, but a better reading would be "flat" for the last 3 weeks.") That was right after I suggested here that maybe things had begun to turn down (though I, of course, carefully qualified that! "With the addition of the new Gallup data, approval has clearly changed its upward trajectory, though by how much remains to be seen. My standard, conservative, estimate shown as the blue line has noticably reduced the upward slope, though continuing to suggest a rise.")
At the risk of proving my stats are smarter than I am (why prove the obvious, you might ask), compare the series of posts in which I've grappled with what is happening to approval. But pay attention to the blue line in the figures-- it is quite consistent. It is my prose that tilts one way or another more than the trend line does. First, there was some evidence of a downturn beginning. The "sensitive but gullible red-line" estimator thought there was a downturn. Stable, reliable, "old blue" reduced the estimated gain a bit, but still trended a bit up. Then some new data reduced the evidence for a downturn, and sensitive red came closer to flat. Blue continued up. More data and red was completely flat while blue still saw an upward trend. Finally, today's data brings the red estimator back into near complete agreement to my standard, and conservative, blue line trend (see the figure below). And what that blue line is trying to tell us is that approval has been inching up for the last five or six weeks, after a period of fairly rapid rise. If only I would listen.
So let this be a lesson to me (and to you, dear reader.) The stats may not be "right", and they certainly may not foretell the future. But the blue line doesn't really much care what other commentators are saying, and it doesn't try to beat the competition with a scoop. It just tries its best to model the data and tell us what its best estimate of approval is, given all the data we've seen so far. The hasty red estimator, which has a lot of fans out there judging from the email, should blush a bit from its performance this last week. What looked like a possible new trend has turned out (so far!) to be an illusion. I'll try to remember that lesson as well.
Click here to go to Table of Contents