UPDATED 8/22@12:00. See bottom of post for new material.
The USAToday/Gallup poll conducted 8/18-20/06 reports that approval of President Bush has jumped to 42%, with disapproval sinking to 54%. The approval number matches another weekend poll by CNN/Opinion Research Corporation taken over the same dates. That is a 5 point jump from Gallup's previous reading of 37% approval over 8/7-10.
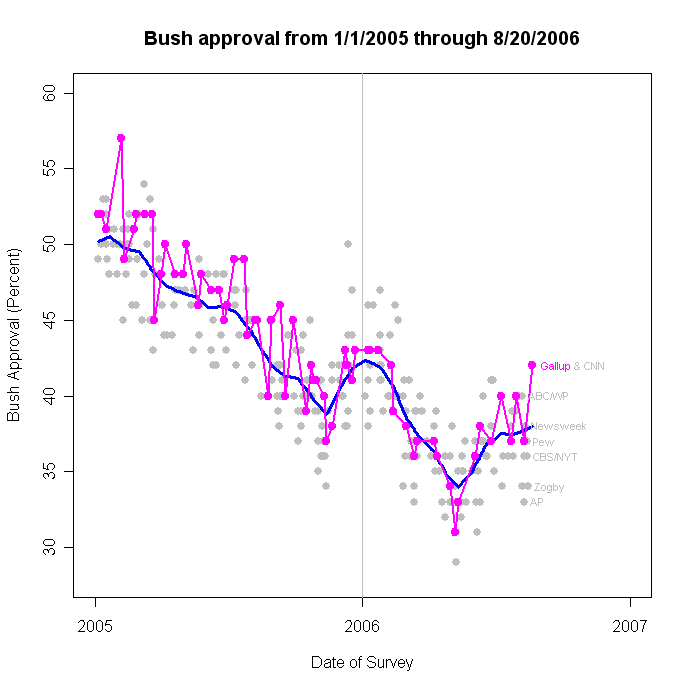
With the new Gallup AND the CNN, my poor would-be-conservative trend estimator is having a hard time knowing where to move. After turning down in the week following 8/7, these two new polls drag the trend estimator into a small upward slope, and a current estimate of approval at 37.96% (or 38% after rounding.) That's a lot of change over the past four or five polls. Between 8/7 and these last two polls, the trend estimator had adopted a small but clear downward slope. Now the opposite-- a small upward trend. What's an honest estimator to do?
One possibility is to take another look at outliers. If we do that, then the new Gallup is also an outlier, as was the CNN poll earlier in the day before USAToday released the new Gallup poll. The outliers are shown below.

Gallup is an outlier even when we allow CNN's result to raise the trend a bit (but exclude the latest Gallup from the outlier trend estimate.) So this demonstrates that Gallup's latest is indeed a bit unusual.
You might also note the number of previous Gallup polls above the upper margin of the 90% confidence interval. Don't be deceived-- Gallup does a LOT of polls, so they would have a number above the top line in any case. In theory, 5% of polls should fall above the upper CI limit. In Gallup's case, 7.7% of their polls have fallen above the top of the CI, while none have fallen below the lower CI limit. This is consistent with Gallup's typical "house effect" which is +.55, indicating the Gallup is on average about a half a point above the average approval across all pollsters. That isn't a lot, and doesn't seem to entirely account for the increased number of Gallup points above the upper CI limit. However, I don't think this is a large enough discrepancy to question the modest house effect estimate, at least not for now.
So the problem is what to make of this wide range of poll results, now reinforced on the high end by two identical results over the same polling dates. I remain reluctant to give full credit to polls that appear to be outliers. Give me a couple more in the 40+ range and I'll change my mind, but for now, I continue to think the trend estimate of 38% (and I'd subjectively say, 36.7-38%) is a better estimate of approval. (36.7 was the estimate before these two polls came in at 42%.) The minor debate would be a slight upward trend or a slight downward one or continued stasis. That must be very much in doubt given how conflicted the trend estimator has been over the past 10-14 days. That approval is moving slowly somewhere in the 36.7-38% range seems pretty strongly supported by the trend and by the usual variability around that. However, the range of recent polls, from AP's low outlier at 33% to these at 42% is a wider range than we usually see. Other recent polls, however, do NOT exhibit higher than normal variability, so I'm sticking to the basic story that we've seen 3 outliers (1 low, 2 high) in a short period of time. That isn't common, but a look at the residual plot shows that it isn't exceptionally rare either.
I'd just like to get a break from outliers for a while!
Update, 8/22: Mike in Maryland in a comment below raises the question of the distribution of partisanship in the two samples. Great point. Here are some results:
My sources "in the kitchen" tell me that the new Gallup has a partisan split of Rep: 33%, Ind: 32%, Dem 34%.The previous poll was Rep: 31, Ind 31, Dem 36. Not a huge shift, but in the Rep direction. The substantial difference seems to come from "leaners". If we add Rep+LeanRep we get 43, vs Dem+LeanDem at 48%. That compares with 39% and 51% in the previous poll.
None of those differences is statistically significant, but they all break the same way, which could shift approval by a bit.
Gallup notes that Independents show the largest shift, up 10 points in approval (from 26 to 36) between 8/10 and 8/20 while the approval rate for Reps remains 81% and Dems are up slightly from 8% to 11%. Since there are more "LeanRep" independents, that would boost the approval rate among independents.
Let's see what effects we'd get from changing size of the R,I,D groups compared to the effects of changing approval rates within groups, and finally to the effect of changing both size and approval, between the Aug 10 and Aug 20 surveys.
A caveat: All the approval and group sizes are rounded to whole percentages. Also, the partisan categories add to 98% in 8/10 and 99% in 8/20 so there are 2% and 1% of the sample unaccounted for who might have expressed approval or disapproval of the President. So the numbers I'm going to get won't exactly duplicate the reported percentages for the 8/10 or 8/20 surveys. But they should be good enough for us to appreciate the components of change here.
First, what if approval rates within group remained fixed but the sample proportion of each partisan group changed:
8/10:
R: 31 x .81=25.10
I: 31 x .26= 8.06
D: 36 x .08= 2.88
------------------
Total approval = 36.05%
(Note this differs from the 37% reported due to the rounding noted above.)
8/20, with DIFFERENT sample but same loyalty rate:
R: 33 x .81=26.73
I: 32 x .26= 8.32
D: 34 x .08= 2.72
-------------------
Total Approval = 37.77%
So the effect of the change in partisan composition alone, holding approval rates fixed within party categories, would be an increase in approval of 1.72%, or allowing for the rounding problem, say in the ballpark of 2%. Not nothing, but not huge either.
Now what if Gallup had managed to keep the size of the R,I,D groups exactly the same (say by weighting to some fixed party id distribution) but the approval rates had shifted within category from what they were on 8/10 to what they are in 8/20:
The 8/10 calculation is the same as above, for a total approval of 36.05.
For 8/20 with the same partisan shares as 8/10 but with 8/20 approval rates:
R: 31 x .81=25.11
I: 31 x .36=11.16
D: 36 x .11= 3.96
-----------------
Total Approval = 40.23
So for a fixed partisan sample, the shift in approval rates would account for a 40.23-36.05=4.18 point increase in approval, or about double the effect of the shifting sample but with fixed approval rates.
If we combine both effects then we get something close to what we actually saw in the published results:
8/20 with both sample and approval rate shifts:
R: 33 x .81=26.73
I: 32 x .36=11.52
D: 34 x .11= 3.74
---------------------
Total Approval = 41.99.
So both effects together account for a 41.99-36.05=5.94 point increase, or about 3 times the effect of sample composition alone and 1.5 times the effect of changed approval rates alone.
Controlling partisan composition would have made approval come out at about 40%, rather than the 42 when both group size and rate vary. That would have been yet another Gallup cycle between 37% and 40% that we've seen over the last several polls. But lets not overstate the composition issue either. It accounts for about 1/3 of the shift between polls. The shifting rates within partisan category are the larger effect here, and it is much harder to argue for some kind of weighting to control those effects. Those who support weighting by party id can rightly claim that such a procedure would have made this latest Gallup merely a bit high rather than an outlier. Opponents of weighting could rightly argue that the shifts due to partisan composition are small relative to the total shift, and fall well within the limits of sampling error for subgroups in any case. By trying to control effects on the order of 2-3 percentage points, we are worrying about effects that are better absorbed as random error into some synthetic statistic, like, say, my blue line approval trend estimator. <;-) Click here to go to Table of Contents