The new Cook Political Report/RT Strategies poll taken 7/28-30/06 finds approval of President Bush at 39%, with disapproval at 51%. This poll is of registered voters. The 39% approval is up two points from June 4th and up three points from April 30, near the low point of my estimated approval trend. The addition of this poll puts my trend estimate at 37.96%, so let's call that 38%. The blue trend line continues up, though at a noticably slower rate than in May and early June. Since mid-June approval has risen by about 1%, while it climbed by 3 points the previous month (May 15-June 11).
If I use my more sensitive "red line" estimate, then approval appears to have been flat since mid-June. I didn't plot that this time. "Hasty red" is clearly having a tough time deciding what the trend should be. Last week it was a bit down, and I wrote a piece asking if Bush was again in decline. All the polls since then have reduced that estimate to where it now stands at no change. This is an example of "hasty red" suggesting something that seems to have been too much response to a couple of polls. My standard "blue line" estimate meanwhile has continued to show a mild gain since mid-June. For now, I'm sticking with it-- but always watching for Red to give us a hint. Right now, that hint isn't very convincing!
With events in the Middle East plus the summer doldrums at home, I'm not making any bets which way approval is going to move next. You can make cases for either direction. So I'll stick to the thing I do have confidence in-- "old blue".
It has been a while since we looked at approval by party identification, and the Cook/RT poll gives us a nice comparison. They include strength of approval, which many others do not do. That lets us look a little deeper than the simple dichotomy, and by party id categories.
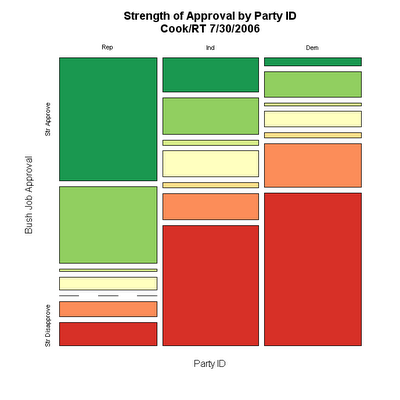
The graph below divides approval into seven categories: strongly approve, somewhat approve, lean towards approval, (neither, not sure, mixed, don't lean either way), lean disapprove, somewhat disapprove and strongly disapprove. The rows of the figure correspond to these categories from top to bottom. The columns are the three party identification categories.
The thing that jumps out of this figure is the very large strongly disapprove group among independents. Fully 46% of independents strongly disapprove of the President's handling of his job. That compares to 59% among Democrats. Just visually comparing the independent with the Dem columns of the figure shows how much independents resemble Democrats at this point. They certainly don't evenly split the difference between Dems and Reps. And that isn't just mild disapproval-- by far the largest single category among independents is strongly disapprove.

The two partisan camps are approximately symmetric: 78% of Reps approve strongly or somewhat, while 76% of Dems DISapprove strongly or somewhat. What tips the balance against the White House is the large group of unhappy independents: 56% of whom disapprove strongly or somewhat. Only 27% approve strongly or somewhat.
As we come into the fall campaign, I wonder if these disapproving independents can be persuaded to back Republican congressional candidates. These folks are not natural supporters of Dems but they seem so put out with the President that I'm not sure a campaign based on anti-terrorism can win them over again. Despite a first ever veto (and failure to override) I'm not sure there is much daylight between the Republican congress and the White House. I expect a number of districts will swing one way or the other on the votes of these unhappy independents. Can they be won back? How? And the flip side of that question: Can Democrats capitalize on this dissatisfaction when the congressional race is between two particular candidates, and not just a referendum on Bush's performance? We know the generic ballot has been favoring the Dems for a while, but then it has done that most of the years since 1994 without a change in control of congress. Any evidence? Yes, thanks to the Cook/RT poll.
The Cook/RT poll uses the following question on preference for control of Congress, rather than the usual "generic ballot" house vote:
Now, thinking about the election for U.S. Congress in November, regardless of how you might plan to vote in your own district, which party would you like to see in control of Congress after the congressional elections in November: The Democrats or the Republicans? (If not sure:) Well, which way do you lean, more towards the Democrats or the Republicans?This item may or may not predict individual House votes well, but it does give us a measure of preference that lets us look at how independents split on this question of control compared to their substantial disapproval of President Bush.
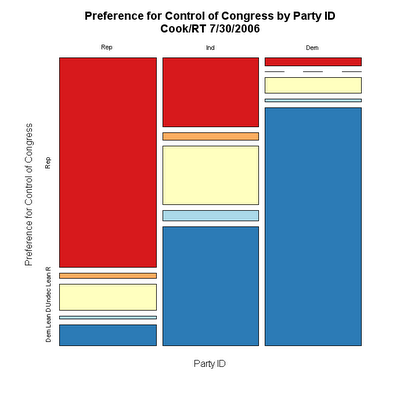
The categories shown as rows run from "Prefer Rep Control", "Lean Rep", "Undecided", "Lean Dem" and "Prefer Dem Control", as we go from top (Red) to bottom (Blue).

That dissatisfaction among independents translates only partially into support for a Democratic congress. While 45% of independents say they prefer a Democratic Congress, this pales by comparison to the Democrats where an overwhelming 90% say the same. That's not at all surprising, but while Independents disapprove of Bush in numbers not too far behind those of Dems, this doesn't translate as strongly into a preference for Congressional control.
Republicans can hardly rest easy from this figure, however. They would need to capture all the undecided and leaning independents in order to break even on the control question. Barely a quarter (26%) of independents say outright they prefer a Republican Congress, while 45% pick the Democrats. That is a lot of ground to pick up for Republicans.
Finally, Republicans have often been more loyal to their party than Democrats. In this figure, there is a small deficit in Republican loyalty: 80% of Reps want a Republican Congress, 10 points less than the Democratic preference among Dems.
Everyone should know the dangers of using this or other "generic ballot" questions to forecast actual votes, let alone swings in seats. But the data do speak to the difficulties Republican's face in the fall elections. Approval shows a massive deficit among independents, and the preference for control suggests that at the very least the Republican party has to win over the vast majority of wavering independents. (At least given this kind of "national level view". If you want district by district analysis, go to the Cook Political Report!)
Click here to go to Table of Contents