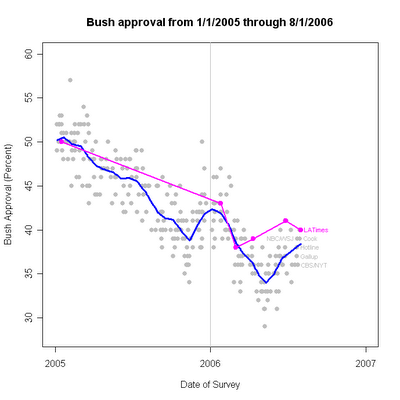
Approval of President Bush is at 40% in the new LA Times/Bloomberg poll taken 7/28-8/1/06. Disapproval is at 58%. This is a one point decline in approval from the previous LA Times/Bloomberg poll taken 6/24-27. As the figure makes clear, the LATimes survey has been running 2-4 points above the trend for the last three polls, though earlier ones are quite close to trend. At two points above trend, the latest survey is certainly far from being an outlier, and roughly balances the negative deviation for the CBS/NYTimes poll of last week. With the addition of the LA Times poll, my trend estimate of approval now stands at 38.4%.
The blue trend line continues up, and has now straightened completely out after some hesitancy following the CBS/NYTimes result for 7/21-25. Polls completed on July 20 or later are 38% (Hotline), 39% (NBC/WSJ), 36% (CBS/NYT), 40% (Gallup), 39% (Cook/RT), and 40% (LATimes/Bloomberg). The five polls prior to July 20th produced approval results of 35% (Time), 34% (Harris), 36% (AP/Ipsos), 36% (Fox) and 36% (Pew). That string in the mid-30s produced some evidence of a possible downturn in approval (discussed in detail here but retracted here) but with the current string of 5 polls it seems clear that the upward trend has continued.
The current rally has had two apparent phases: May 12-June 19 in which approval rose from 34.0% to 36.8%, a rise of 1 percentage point each 13.4 days. From June 19 to August 1 the rate has been 1 percentage point each 27.1 days.
This reduced rate of increase helps explain why many polls appear to be finding little evidence of change. At this rate, we would need more than three and a half months of polling to expect to detect a "statistically significant" difference given typical sample sizes. The evidence of my trend estimate is that approval is clearly still rising and has been for the last 81 days, but no single poll will be able to detect this reliably with a 3% margin of error when polls are taken at one week, two week or even four week intervals. So we get conclusions of "stability", "unchanged" or "flat approval ratings" even when the clear evidence of the figure above is that the trend remains up. This is a clear example of the power of aggregating across many polls. (For those who are tuning in late, these issues of detecting change in approval are discussed at length here, here, here and here.)
If the current rate continues, we should see approval at about 42% on election day, with polls varying between 48% and 36%, with most polls between 39% and 45%. (The variability of polls around my trend estimate is actually +/- 6.7% at a 95% confidence interval.)
Of course there is no reason to believe the current trend will continue unchanged for the next 97 days. This rally is already the longest running since January of 2005. The fall campaigning is apt to change the rate as President Bush plays a central roll. But which way?
Click here to go to Table of Contents