This item serves as a Table of Contents to the topics I'm currently covering. Click on an item to jump to it, or scroll down to browse through all the recent posts. (Click a graph, and click again for best resolution.)
Current Approval of President Bush
Bush Approval: Four polls, Trend at 36.2% (10/23) New!
Bush Approval: Three new polls, Trend at 35.8% (10/17)
Bush Approval: Three new polls, Trend at 37.2% (10/13)
Bush Approval: Four New Polls, Trend at 38% (10/10)
Bush Approval: Newsweek 33% (10/7)
Bush Approval: Trend turns down (10/6)
Bush Approval: NBC/WSJ and CNN at 39% (10/2)
Bush Approval: Three polls agree on 42% (9/28)
Bush Approval: Still rising (9/27)
Presidential Approval in Perspective: UPDATED through polling of 10/22/06
See the links to current and historical presidential approval graphs in the column to the right.
Generic Ballot
Generic Ballot: Dem lead widens post Foley (10/10)
Generic Ballot: Decline ends, upturn?? (10/06)
Generic Ballot: Three polls slightly below trend (9/28)
Generic Ballot: After a dip, stable (9/27)
Technical Notes on Local Regression
Many of the "trends" I estimate here use a technique known as "local regression." A very good, not-too-technical description with a good bibliography can be found at the National Institute of Standards and Technology here. For a more technical discussion by William Cleveland, the developer of the technique I use, see his paper here (in pdf). All computation is done in the R
statistical language, an open source, free, program for statistical computing, about which much more here.
Basic Trends: A review of favorite indicators
Generic Ballot: New polls mostly below trend (8/28)
Votes, Seats and the Generic Ballot (8/18)
Generic Congressional Ballot (8/15)
Approval of Bush's handling of terrorism (8/13)
Right Direction/Wrong Track(7/27)
House Races
Hot House Races Lean Dem (9/7)
Hillary Clinton
Hillary's image: 1993-2006 (8/31)
Katrina
Katrina and Bush, One Year Later (8/29)
2006 Campaigns in the States
WI Gov: New polls, same story (8/18) Updated 8/21.
WI Gov: Pollster (and sample) still matters most (7/20)
When the pollster matters most: WI Gov 06 (7/11)
WA Sen: Cantwell-McGavick getting closer? (7/10)
Puzzling Polls in PA Pondered (6/29)
Polling Organizations and House Effects
House Effects and Presidential Approval UPDATED through polling of 8/9/06
Is there a limit to how low presidential approval can go?:
How low can approval go? (3/4)
Historical Footnote
Approval at new low-- for President Truman (7/2)
The problem of detecting change in polls
Up, down or unchanged: Describing poll results (6/17)
"Unchanged since Yesterday": Detecting Change in Presidential Approval (3/26)
New low or steady as you go? Has Bush's fall stopped? (3/23)
Partisanship, Approval and Congressional Elections
Bush Approval: Cook/RT at 39% (8/1)
(This item covers two topics, hence listing it here and under current approval.)
Stem cell opinions and votes
Public support for stem cell research (7/19)
The '08 Contenders
Feingold at home: No censure/withdrawal reaction (7/27)
Conflicting polls
When the pollster matters most: WI Gov 06 (7/11)
Puzzling Polls in PA Pondered (6/29)
Presidential Approval at Midterm
Approval and Midterm Seat Loss: Two Problems (5/10)
Midterm Presidential Approval and 2006 (5/2)
Partisanship and polling:
Party ID and presidential approval (4/5)
Partisanship moves (3/20)
Partisanship across polls (3/2)
Monday, October 23, 2006
Bush Approval: Four polls, Trend at 36.2%

Four more polls in today revise the trend estimate of approval of President Bush to 36.2%. CNN/ORC taken 10/20-22/06 has approval at 39%, disapproval at 58%. ABC/Washington Post, taken 10/19-22/06 has approval at 37%, disapproval at 60%. Newsweek, 10/19-20/06 found approval at 35%, disapproval at 57%. The new Cook/RT Strategies poll, taken 10/19-22/06, got approval at 37%, disapproval at 53%.
The trend estimate is revised up from 35.8% as of polling through 10/15. The trend line (the blue line) remains down because the new data revises the rate of decline, rather than demonstrating (so far) a reversal of the decline. It typically takes 6-12 polls for a change of direction to be clearly revealed by the trend estimate. So far, the data do not hint that a reversal of direction has occurred. For example, the "sensitive" estimator shows a hint of flattening, but no upturn. Since the sensitive estimator is easily fooled, it is too soon to say approval has stabilized. More data this week should help clarify this, however.
The figure below shows the four new polls. All results are reasonably close to the trend estimate. In response to a comment on the earlier item, I reran the analysis of Newsweek's previous poll, which I showed was an outlier, beyond the 90% confidence interval. Repeating that analysis with the new polls included does not change that result. For the time it was conducted, the previous Newsweek poll is still unusually low. Their new poll, in contrast, is well within the 90% CI, as are the vast majority of their polls.


Tuesday, October 17, 2006
Bush Approval: Three new polls, Trend at 35.8%

No time to write this up. Come back for that later. Bottom line: CNN at 36%, Gallup and Zogby at 37%. Trend estimate falls to 35.8% This is a stunning decline that doesn't yet seem to have reached bottom. Can the White House do anything to stop it?

Friday, October 13, 2006
Bush Approval: Three new polls, Trend at 37.2%

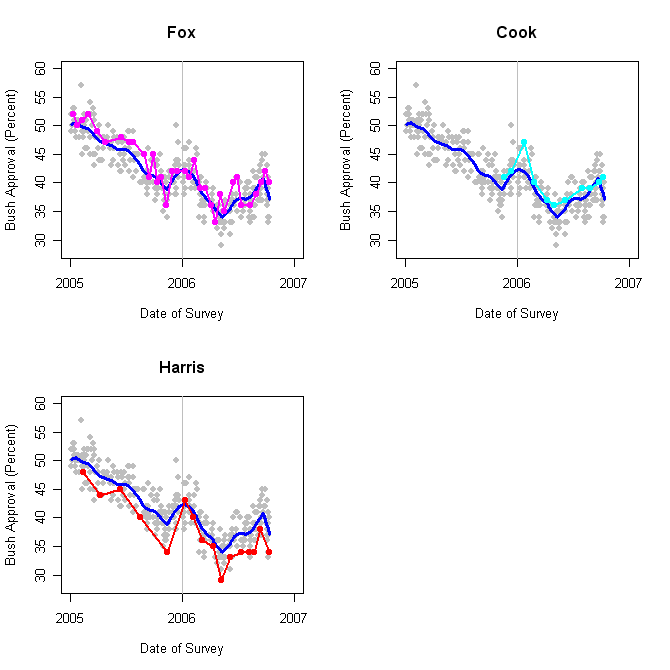
Of three new polls, two place approval of President Bush at or above 40% while one comes in at 34%. Last week's Cook Political Report/RT Strategies poll, taken 10/5-8/06 finds approval at 41%, disapproval at 54%. The new Fox poll from 10/10-11/06 has approval at 40%, disapproval at 56%. And a Harris Interactive poll done 10/6-9/06 puts approval at 34% and disapproval at 64%. (For a plot with just the trend line estimate and the data points, click here.)
With the addition of these new polls, my trend estimate has continued to decline, now standing at 37.2%. Interestingly this trend estimate is virtually identical whether I use my usual "conservative" blue line estimator or the more sensitive (but easily fooled) estimator. While two of these polls are still in the 40s, the Fox and Harris estimates represent declines from their previous result. Cook is a small rise from their previous reading. The current spread of results is consistent with the usual variability around the trend line of approximately +/-4.8%.
An easier to see comparison of the individual polls with the overall trend is shown in the figure below. There are some clear house effects between the polls, but each tracks the trend reasonably well.
Click here to go to Table of Contents
Tuesday, October 10, 2006
Generic Ballot: Dem Lead Widens Post Foley

The post-Foley Folly polls find an upturn in the Democratic margin in the generic Congressional ballot. Prior to the Foley developments, Democrats held a 10.6 point lead in the polls. (This is the Dem percent minus the Rep percent.) That lead has now jumped to 12.8 points, the highest my trend estimate has reached in the 244 generic ballot polls taken this election cycle. This is all the more important because prior to the Foley Fiasco the trend had moved a bit down, then flattened (though still at or about 10.6, a very strong margin even then.) Whatever possible gains Republicans were beginning to make have now been wiped out.
One important concern is that CNN and Gallup produce extraordinarily high values on the generic ballot in this poll. (Remember, these are now down independently-- CNN uses Opinion Research Corporation for it's polling, while Gallup now polls for USAToday only since the dissolution of the old CNN/USAToday/Gallup partnership.) These values of over 20 points are simply implausible given the rest of the data over the past two years, and the other data from the past two weeks. Could it be that my trend estimate is being unduly influenced by these two absurd results?
No. If I exclude the latest CNN/ORC and Gallup/USAToday polls, the trend estimate is a Democratic advantage of +12.4 points, rather than the 12.8 points if these two are included. That small change in trend would still be the highest Democratic margin of the past two years, and when plotted the line without these polls is visually all but indistinguishable from the blue trend line in the figure.
And so we are back to the key question: how much will this huge (compared to elections since 1994) Democratic lead translate into seats? Will we see movement in polls for individual House races move as well? Stay tuned.
Click here to go to Table of Contents
Bush Approval: Four New Polls, Trend at 38%
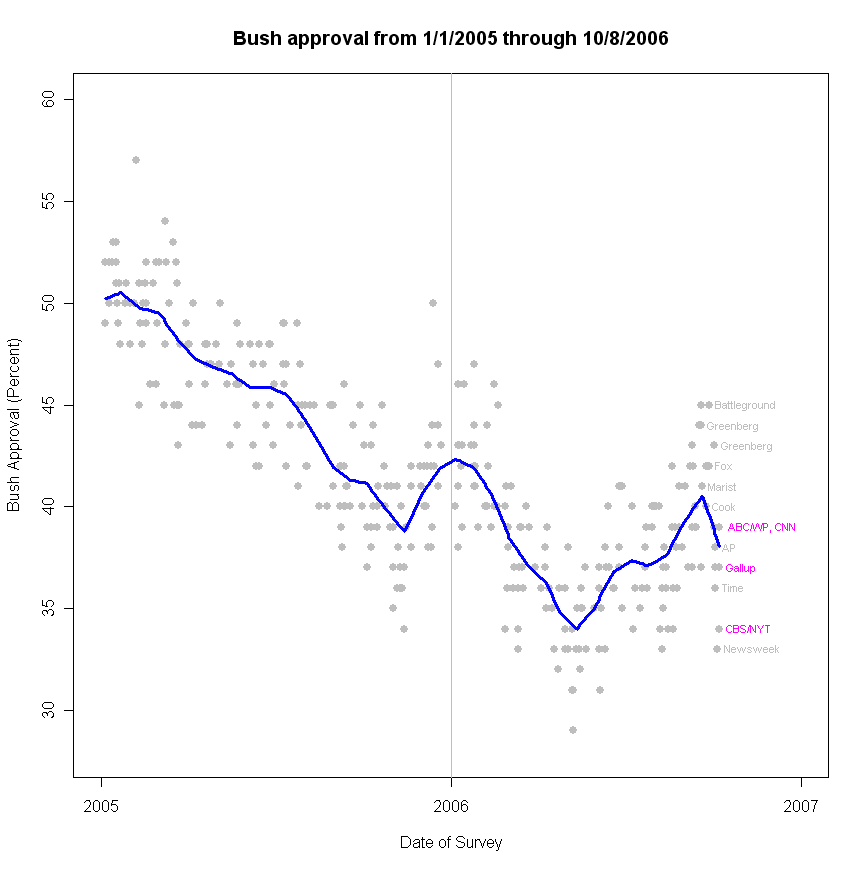
Four new polls find approval of President Bush has declined substantially since the end of September, following revelations of "overly friendly" email and IM messages from Rep. Mark Foley (R-FL) to pre-adult House pages. All these polls were completed before North Korea tested what appears to have been a nuclear weapon on October 9.
The ABC/Washington Post poll, taken 10/5-8/06 finds approval at 39%, disapproval at 60%. CNN/ORC's poll from 10/6-8/06 also has approval at 39% with disapproval at 56%. The Gallup/USAToday poll (10/6-8/06) found approval at 37%, disapproval 59%. The CBS/New York Times poll (10/5-8/06) comes in low among this group, with approval at 34% and disapproval at 60%.
With these new polls, the approval trend estimate has fallen sharply to 38.1%, a bit more than a 2 point drop since mid-September.
Each of the polls shows a decline from the same poll's previous reading. These are too crowded to plot all four in one image, so here they are by poll.
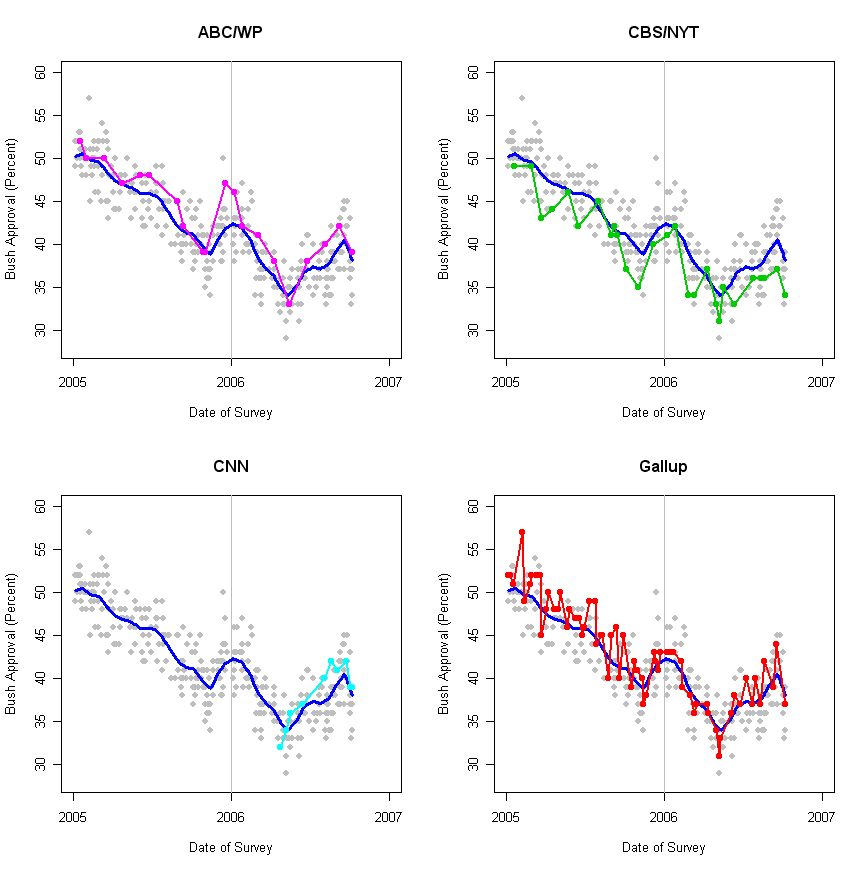
The CBS/NYT poll is quite low compared to the others, raising the possibility that it is another outlier, as was the Newsweek poll over the weekend. The graph below checks this, and finds that CBS/NYT is NOT an outlier, despite it's low reading of approval. With the new data, Newsweek remains an outlier, though less extreme than before the trend was revised by the four new polls.

The conclusion is obvious. Approval has now given up most of the gains made in the August-September rally.
Click here to go to Table of Contents
Saturday, October 07, 2006
Bush Approval: Newsweek 33%

A new Newsweek poll finds approval of President Bush at 33%, a record low for the Newsweek organization, though not for other polls. The poll, taken 10/5-6/06 also found disapproval at 59%. As the graph above makes clear, however, the Newsweek poll is far below other recent polls and the current trend estimate. Before concluding that approval has "really" fallen to 33%, a good deal more data will have to confirm this extremely large drop.
That is not to say that approval has not turned down. Indeed, after the last two weeks of unremitting bad news for the White House, it is hard to imagine how if could have failed to do so. The question is whether the Newsweek poll is a reasonable estimate of current opinion or if it is too far away from other results to be plausible.
With the addition of the Newsweek poll, my current estimate of approval (the dark blue line) stands at 39.4, a full point below the recent high of 40.4 on 9/20. (This value is constantly being revised as new polling allows better estimates of the peak. On 9/19 the estimate was 41.1, while on 9/21 it stood at 41.2. Three polls completed 9/25-9/27 agreed on 42%, driving the estimator that day to 42.2. However, in light of all the polling since, the revised estimate puts the recent high at only 40.4 as of 9/20.)
While a one point drop may seem small, this is a drop in the trend estimate, NOT the very noisy raw polls which move by much more from poll to poll but which also contain much more random variation. One point in 16 days is almost 2 points per month, which is quite a substantial rate of decline. For comparison, during the first five months of 2005, the President's approval declined by one point each 13.5 days, as estimated just before approval reversed and started back up on May 15. I hasten to add that we lack enough data to be at all confident as to what the current rate of decline actually is. One point per 16 days is merely the best guess given current data. It might be less or more and will certainly change as new data come in.
So granted approval is now clearly going down, is the Newsweek poll telling us that the drop is of historic rapidity and that new polls will also show similarly dramatic drops, or is Newsweek's poll a statistical outlier-- getting the direction right but seriously overstating the magnitude of decline?
Based on all polling since 2002, the Newsweek result is clearly a statistical outlier. It is well below the 90% confidence interval in the figure below and is among the larger negative outliers of the past four years. The figure plots the residuals, the deviation from the trend estimate, for each poll taken since January 1, 2002. Orange points are polls that fall outside the 90% confidence interval, indicated by the low and high horizontal lines. The mean of all residuals is zero, the middle horizontal line. Newsweek polls are in red for easy identification.

Newsweek has a good polling track record, producing only one previous outlier in 70 polls. Here "outlier" is any poll outside the 90% confidence interval. By definition, we expect 10% of cases to fall outside that range. In fact, Newsweek has now produced two out of 71 polls since 2002 that are outside that 90% CI, a 2.8% rate. This latest poll, however, is clearly well beyond the lower limit of the interval.
Two recent polls have also fallen outside, but above, the 90% CI. Both of these were completed prior to the revelations about Representative Foley's IM messages to House pages, though after the now estimated peak of approval on 9/20.
Even if we focus on the four polls completed (at least partially) since the Foley Folly began, we see that all four are well below the trend estimate, but that the Newsweek poll is substantially below even these polls.
The conclusion is that the Newsweek poll is implausibly low, given the other data we have seen so far. A possible (but statistically less likely) alternative is that approval is falling very rapidly so that the unusually low Newsweek result reflects a much sharper rate of decline than the 1% per 16 days that I currently estimate. Such a rate of decline would be much higher than any yet seen in the Bush administration. I find this quite unlikely, but the data will answer this one way or another within a couple of weeks. For now, I'd bet the approval trend will fall another half point by the end of next week. If it falls much more than that, the Newsweek poll will look like a harbinger rather than a statistical fluke.
Click here to go to Table of Contents
Friday, October 06, 2006
Generic Ballot: Decline ends, upturn??

I'm between planes so no time for a full post, but the generic ballot that was trending slightly down two weeks ago is now at least flat and perhaps very slightly rising. Too soon to tell what the real effect of the Foley affair will be, but certainly the trend has shifted from down to flat. I'll post more at the next delayed flight (which could be soon.)
Click here to go to Table of Contents
Bush Approval: Trend turns down

More post-NIE, post-Woodward, post-Foley polls are out, suggesting that approval of President Bush has stopped its recent rise and has begun to turn down. Polls from Time, AP and Greenberg find small declines since the previous poll. A Pew poll finds no change. A GWU-Battleground poll is useless for comparison because the previous poll is from February.
The Time poll, taken 10/3-4/06 finds approval at 36%, disapproval at 57%. The AP poll from 10/2-4/06 has approval at 38%, disapproval at 59%. Pew's survey from 9/21-10/4/06 gets approval at 37%, disapproval at 53%. Greenberg/Democracy Corps was in the field 10/1-3/06 and has approval at 43%, disapproval at 53%. The GWU-Battleground poll is a bit stale, conducted 9/24-27/06. It found approval at 45% with disapproval at 53%.
The net effect of these polls on my estimate of approval is a drop of 0.4 points from the peak on September 20 to a current estimate of 40.2%. That peak, however, is also a revised estimate. Without the newer polling, the approval trend had reached 42.0%. The revised estimate of the peak is only 40.6, so recent polling has called the previous high into question. More data will be needed before we can precisely estimate either the September high point or the precise date when the turn in support took place.
While the AP, Pew and Time are generally below the trend estimate, their effect on the trend estimate is balanced by the typically high approval values from the Greenberg/Democracy Corps and GWU-Battleground polls. Likewise the "apples-to-apples" comparison of the plot for each polling organization increases the evidence that there is now a downturn in approval. Obviously we can't yet estimate how large or how sustained this turn may be.
The Pew poll is interesting because it was in the field before the Foley news broke, having collected 777 cases, and then collected an additional 726 cases after the scandal became known. Comparisons of "before" and "after" show an identical 13 point Democratic lead in the generic ballot question, suggesting no immediate impact of the Foley news on vote intentions.
Of course, as with so many Washington scandals, the story is as much about the aftermath of the revelations as the acts themselves. The "what did they know and when did they know it" drama now playing out around Speak Dennis Hastert seems likely to keep the story in the news for at least a few more days. One doesn't need polls to know this has been a bad week for the Republican party. How much that affects polling, and how long such an effect endures, remains to be seen.
For President Bush, the key question is whether he can resume his aggressive campaign efforts and can stay on his message of national security and terrorism. And if anyone is listening to his pitch at the moment. The challenge for Republicans is to change to subject. The challenge for Democrats is to take advantage of the October surprise effectively and to use Foley to advance a broader critique of the Republican congress. Stay tuned!
Click here to go to Table of Contents
Wednesday, October 04, 2006
Bush Approval: NBC/WSJ and CNN at 39%

Two new polls find approval of President Bush has fallen after a week of mostly bad news. The NBC/Wall Street Journal poll, taken 9/30-10/2/06 finds approval at 39% and disapproval at 56%. The CNN/ORC poll conducted 9/29-10/2/06 also puts approval at 39%, with disapproval at 59%. Both polls had registered approval at 42% in their previous readings. These polls come after a week that included debate over a new National Intelligence Estimate's conclusions on terrorism and Iraq, Bob Woodward's new book, and culminating with revelations of Rep. Mark Foley's email contacts with congressional pages. The polling was completed before the Washington Times called for House Speaker Dennis Hastert's resignation as speaker.
The new data do not yet lead to a major change in my approval trend estimate. That currently stands at 41.4%. That's a revision down from 42.0%, but the trend has not yet turned clearly down. The trend line is deliberately conservative, and usually requires 6-12 polls before considering a change of direction reliable. The three point drop in two polls, however, does suggest that President Bush may have suffered a significant reversal over the past week, after some 6 weeks of strong upward movement in approval. It is likely that more new polling will arrive soon, helping clarify how much of this move is a "blip" and how much a harbinger of a change in direction.
Click here to go to Table of Contents
Thursday, September 28, 2006
Generic Ballot: Three polls slightly below trend
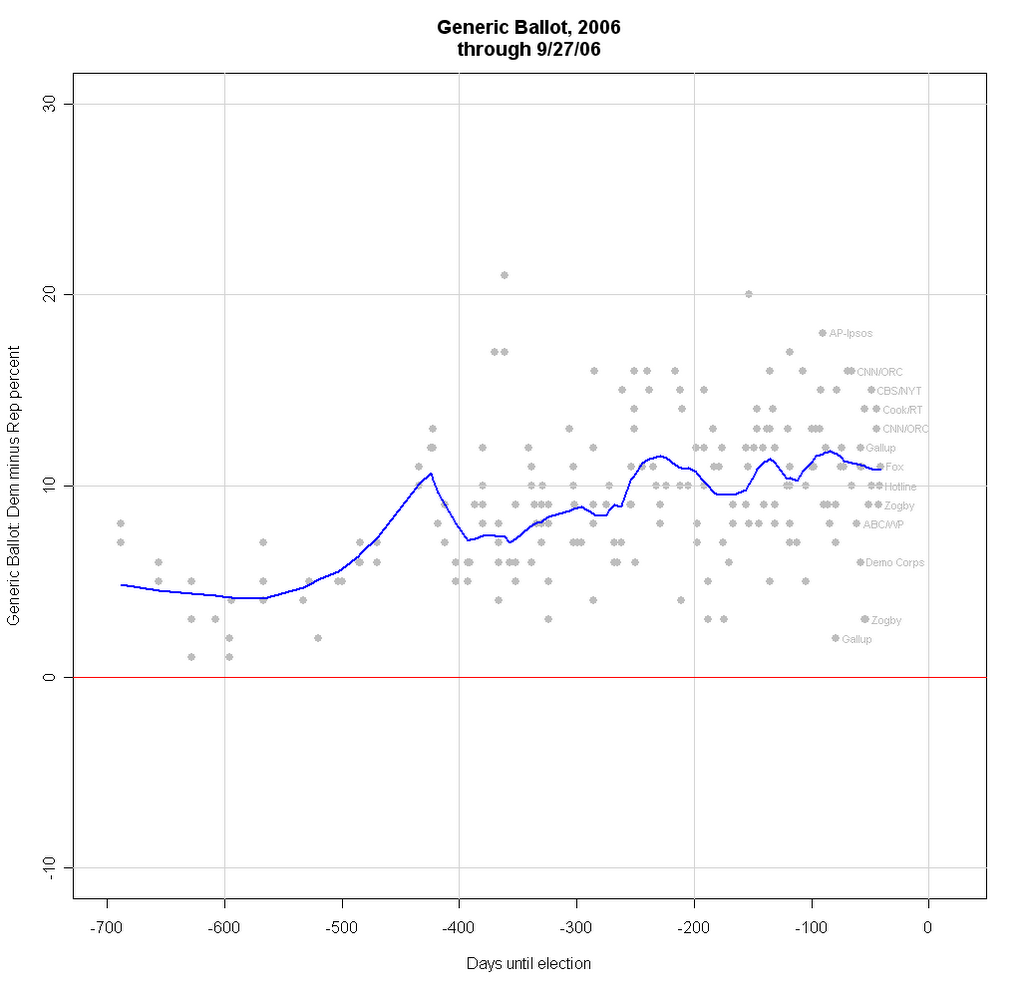
Three new polls put the Democratic margin over Republicans in the generic ballot House vote at +10, +11 and +9. Those are slightly below the previous trend estimate of +11.4, and with these new polls added, the trend estimate now stands at +10.8. This still leaves a relatively flat trend following about a 1 point decline in the Dem margin. As I wrote here yesterday, the surge in support for President Bush (to 42.2% today, see here), appears not to be driving the generic ballot, at least not yet. The trend estimate has remained between +10 and +12 for the last 150 days or so, though with some small cyclical movement.
Click here to go to Table of Contents
Bush Approval: Thee polls agree on 42%
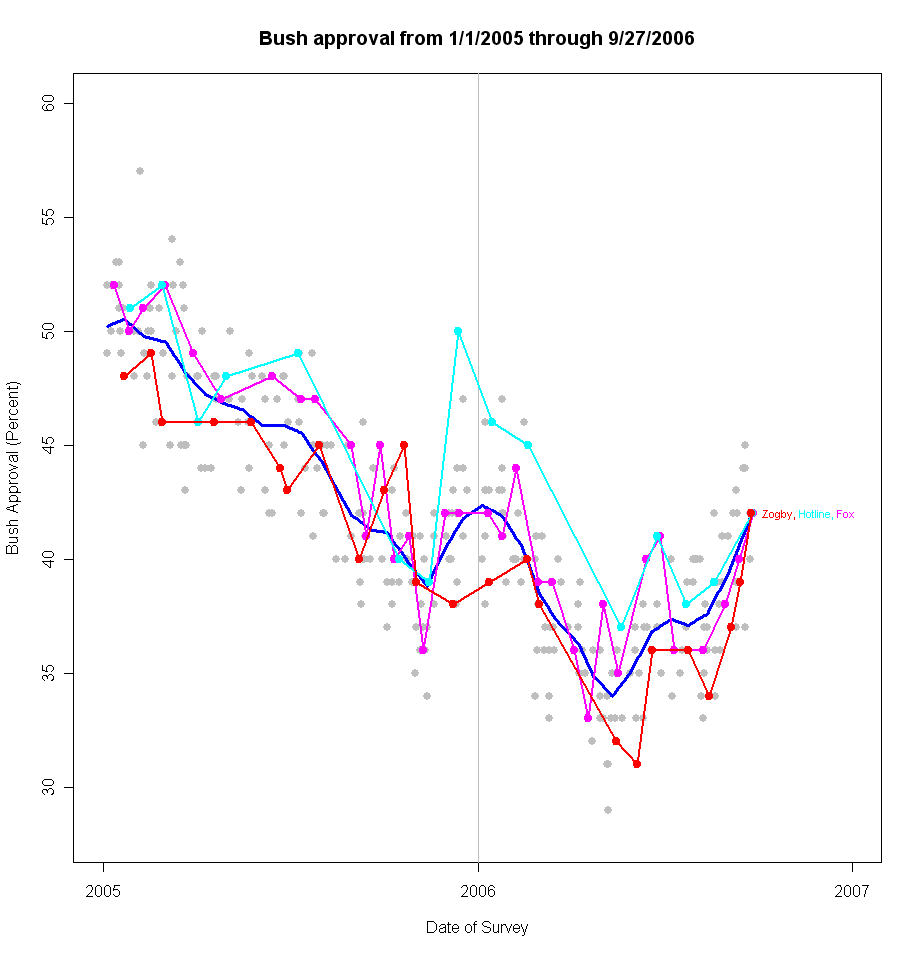
Three new polls all tell the same story today. Approval of President Bush stands at 42% in new Fox, Hotline and Zogby polls. And the current trend estimate is now 42.2% to boot.
The Fox poll was completed 9/26-27/06 among 900 likely voters, finding 54% disapproval. The Diageo/Hotline poll was done 9/24-26/06 interviewed 800 registered voters, and got disapproval at 56%. The Reuters/Zogby telephone (not internet) poll was done 9/22-25/06 among 1000 likely voters, and has 58% disapproval. All three polls also show increases over the past two or three polls.
This week's developments with former President Clinton's outburst on Fox, and his advice on Russert to Democrats about how to campaign on security, plus the leak and then release of the National Intelligence Estimate and surrounding debate, plus the White House response to both these, raises an interesting question of what comes next for Presidential approval. It is my impression that the White House has held the initiative in political debate over the past several weeks, with little effective Democratic response (this is just my impression-- I have no direct data on this). Certainly the observed data demonstrate that the White House has "won" the last 5 weeks. So where is the Democratic counter attack? Was Clinton attempting to lead his party in a new offensive? Or am I wrong and Democrats have in fact been actively responding to the President? If so, it hasn't worked very well, has it. Either way, now what?
Click here to go to Table of Contents
Wednesday, September 27, 2006
Generic Ballot: After a dip, stable
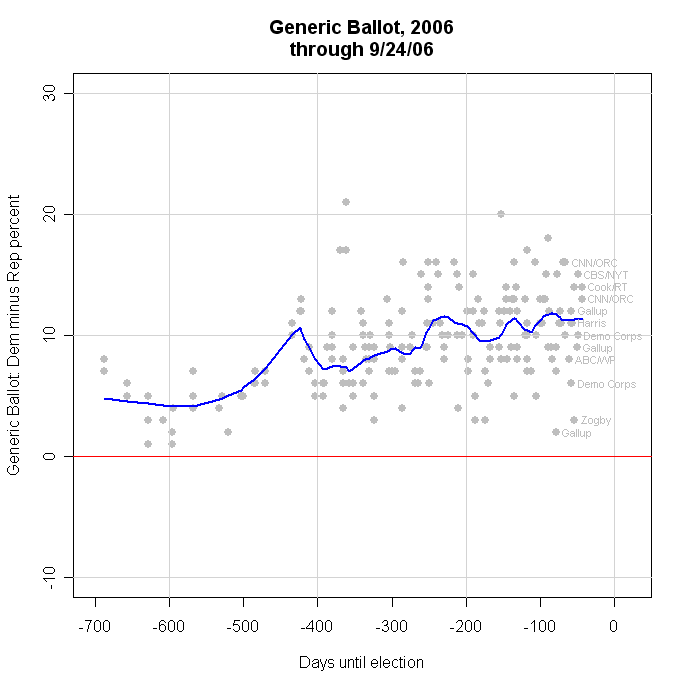
After a flurry of polls indicated a dip last week, the generic ballot for the House now appears to have stabilized. Last week the Democratic lead (that is, Dem% minus Rep%) fell from +12 to +10. New polling however suggests that the dip was less and now estimates the Democratic lead at +11.4%. More important, the upturn in Bush approval rating that remains quite strong now appears not to be driving the generic ballot, as it seemed to be doing last week. (See the latest approval trend here.) With the new data, the dip appears mild and the trend is now flat. This is not out of line with Senate polls which have so far failed to show a move in the Republican direction over the past couple of weeks.
The range of values on the generic ballot is striking. While all polling is variable, it is clear from the polls indicated in the right of the figure, that this question produces a strikingly large range of results. In part this is a simple artifact of the measure being the LEAD of Dems over Reps. The variability of a difference is larger than the variability of either of its components. So if the margin of error for the Dems and for the Reps is 3%, the margin of error for the difference is close to 6%. Even so, readers would be well advised to be wary of highly variable polling on the generic ballot. A lot of attention is being paid to this measure which is certain to vary a lot from poll to poll. Simply looking at the latest poll compared to the previous is likely to vastly overstate amount of change that is taking place. That variability also means it is hard to know precisely where the measure stands, based on individual polls. The trend (blue line in the figure) is the best estimate. And remember, translating the generic vote margin into seats is also an uncertain business. See here.
Click here to go to Table of Contents
Bush Approval: Still rising

Three new polls continue to support a rise in President Bush's job approval rating. The Cook/RT Strategies poll taken 9/21-24/06 (RV) finds approval at 40%, disapproval at 50%. The Democracy Corps (Greenberg) poll of 9/17-19/06 (LV) has approval at 44, disapproval at 52. And the CNN/ORC poll from 9/22-24/06 (A) reads 42% approve and 55% disapprove. (RV, LV and A are the populations sampled: Registered or Likely voters, and Adults, respectively.)
These results neatly bracket the trend line, which now stands at 41.8% approval. We continue to see the usual variability across polls, but the upward trend has been consistent across a substantial number of polls since mid-August when the current upturn began. So far there is no indication that the rate of increase has changed, and that rate is sharper than either of the two previous rallies since January 2005, having risen some 5 points in 5 weeks.
The question everyone wants answered is what effect will this have on the House and Senate races. So far, not much. The House generic ballot initially moved 2 points in a Republican direction, but has now stabilized. (See my post on the latest Generic Ballot trends here.) In the individual Senate races, the trend has, if anything, favored the Democrats slightly over the most recent polling. (See the Election Scorecard at Slate that Mark Blumenthal and I produce.) The approval rating remains quite low for a president at midterm, so the upward trend, while strong, may not in fact signal much positive influence of the improved Bush ratings for Republican congressional candidates. At best, they may reduce the weight of the anchor those ratings were previously. On the other hand, if approval continues up at its current pace, and if we assume it is higher in the most critical swing districts than it is nationally, then by election day presidential approval could have become a positive asset for Republicans in the most crucial races. (Note the two "ifs" in that last sentence.)
Click here to go to Table of Contents
Thursday, September 21, 2006
Bush Approval: CBS/NYT 37%, LATimes 45%
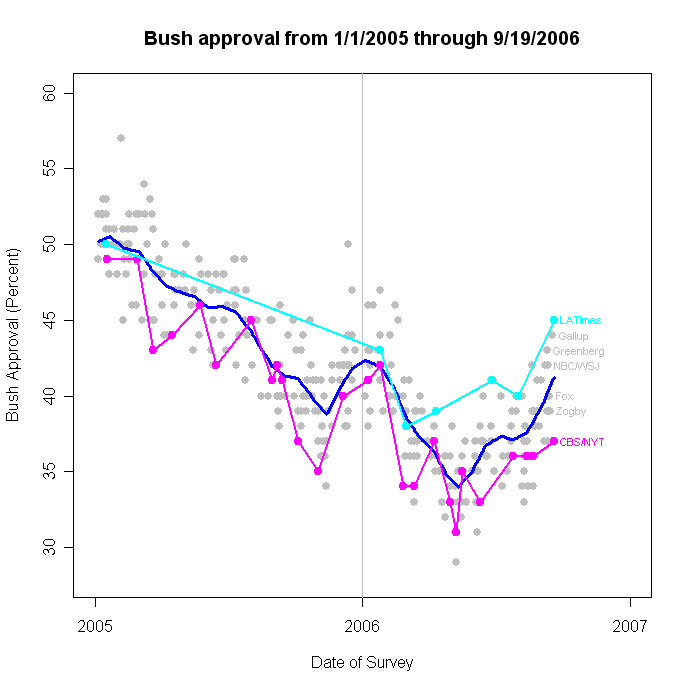
Two new polls give substantially different estimates of President Bush's job approval rate. The CBS/New York Times poll (9/15-19/06) finds approval at 37% and disapproval at 56%. The LATimes/Bloomberg poll (9/16-19/06) has approval at 45%, disapproval at 52%. (The LATimes/Bloomberg poll also gives results for Registered Voters (RV): 44% approval, 54% disapproval. My analysis uses all adults whenever available. This is the most common population sampled.)
While these two polls disagree with each other, they are consistent with my trend estimate, though at the opposite ends of the range of normal variation around the trend. With both polls added, the trend estimate (dark blue line) stand at 41.2% approval.
The LATimes/Bloomberg poll finds approval increases across all party categories, from their 7/28-8/1/06 poll. Support for President Bush rose from 77% to 83% among Republicans. Among Independents support increased from 33% to 38%. And even among Democrats the rate rose from 11% to 19%. The latter is interesting given the common claim that opposition among Democrats is so strong that minds are made up and unchangeable. The CBS/NYT found little change among partisan groups, which is in keeping with the mere 1 point change in overall approval. Their approval results were 75% among Republicans, 31% for independents and 9% for Democrats. In their previous 8/21 poll CBS/NYT found 74% Rep, 31% Ind, and 7% Dem approval rates.
The CBS/NYT poll consisted of 30% Republican, 32% Democrat and 32% Independent. That is down 3 points among Dems and up 5 points for independents, with no change in the Republican category compared to the previous CBS/NYT poll. The LATimes did not provide a partisan breakdown (though they do provide a breakdown of many survey questions by party, which is welcome. It would be more welcome if they also told us how many are in each party group.)
One notable feature of the CBS/NYT poll is that it opens with a pair of questions on the "way things are going in the United States":
"I'd like you to compare the way things are going in the United States to the way they were going five years ago. Generally, would you say things are going better today, worse today, or about the same today as they were going five years ago?"This is interesting in comparison to the opening question in the LATimes/Bloomberg survey, the often used "right direction/wrong track":
"And what is your best guess about the United States five years from now? Generally, if things go pretty much as you now expect, do you think things will be better, worse or about the same as they are today?"
"Do you think things in this country are generally going in the right direction or are they seriously off on the wrong track?"CBS/NYT finds only 18% saying things are going better today, 60% worse, and 19% say things are the same. The LATimes poll finds 31% saying right direction and 61% wrong track. In both polls the presidential job approval question follows these opening questions (which is a common placement.) You might wonder if the CBS/NYT invites "retrospective" evaluation of President Bush by the direct comparison of now to five years ago. However, the "worse" response in CBS/NYT matches closely the "wrong track" response in the LATimes/Bloomberg. So if this question order affects the results, it must be because of the temporal comparison in one compared to the current status (without comparison) in the other.
Click here to go to Table of Contents
Tuesday, September 19, 2006
Bush Approval: Gallup at 44%
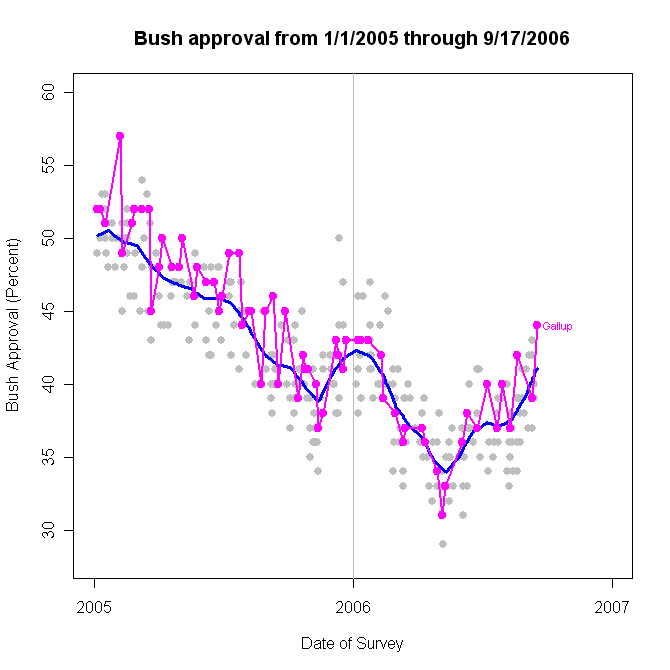
The latest Gallup poll finds approval of President Bush reaching 44%, the first time Gallup has been that high in the year since 9/26-28/05. The poll taken 9/15-17/06 also finds disapproval at 51%, also the lowest since September of 2005. With this poll included, my trend estimate rises to 41.1%. As the latest and also highest poll this Gallup exerts considerable influence on the trend estimate, which stood at 40.0% prior to adding the Gallup data. That's a lot of influence for one poll, and it is likely that the trend estimate will adjust down when more polling arrives. Gallup is at the upper end of the normal range of variation around my trend estimate-- not enough to be an "outlier" but certainly at the high end of variability. That strongly suggests that new polls are likely to be closer to 41% than to Gallup's 44%. The result will be some reduction in the trend estimate. At least that's the smart bet.
But what is very clear is that the trend in approval continues to move strongly up. This begs the question of how long the trend can last. Previous upturns in November 2005 and May 2006 ran their course in about a month, with a subsequent plateau. The November-December 2005 rise was followed by rough stability through January 2006, while the May-June 2006 increase was followed by a steady 37% plateau through most of the summer. By that standard, it is easy to imagine that the current improvement in approval could easily last through election day.
Click here to go to Table of Contents
Monday, September 18, 2006
Bush Approval: Lots of polls center on 40%

A ton of new polls have arrived since September 1, with a range from 37% approval to 43% approval. The spread is quite even around the trend estimate, which now stands at 40.0% approval.
Some polls are in switching from samples of adults to samples of registered or even likely voters. That has caused some concern about the possible effects this has on the approval estimate. NBC/WSJ and AP/Ipsos have provided comparative results which show small affects of the change in sampled population. NBC/WSJ compared June and July samples for both adults and RVs, finding a one percentage point increase in approval (and one point decline in disapproval) in both months, from 37% to 38% in June and from 39% to 40% in July. Interestingly, when NBC/WSJ made the same comparison for CONGRESSIONAL job approval, approval actually went DOWN by one point in each month.
The AP/Ipsos polls offers a comparison of Adult, RV and LV samples for their 9/11-13/06 samples. For Adults, approval is 39%, for RV it rises to 41% and for LV it falls back to 40%. This last result shows that an improvement in Bush approval need not increase as the sample moves to likely voters. Much of the polling so far has found that Democrats are somewhat more likely to say they are certain to vote this fall than are Republicans. The "discouraged" Republican is a great concern for the GOP strategists and is possibly reflected in this AP data. While Republicans remain more likely to be registered to vote than Democratic identifiers, the traditional Republican turnout advantage may be somewhat reduced this year. Of course, that depends on who actually shows up on November 7, and that's a long ways off still.
Click here to go to Table of Contents
Wednesday, September 13, 2006
Bush Approval: NBC/WSJ 42%, Trend tops 40%

The NBC/Wall Street Journal poll taken 9/8-11/06 finds approval at 42%, with disapproval at 53%. This is the fourth poll since 8/27 to find approval at 41% or 42%. That makes four of the last eight polls at 41 or 42. The last eight approval ratings are: 39, 41, 38, 41, 37, 42, 39, 42.
With the latest addition, my trend estimate of approval is now at 40.6%, the first time the approval trend has topped 40% in some long while. The last reading over 40% was 2/16/06. This continues to be quite a sharp and substantial upturn.
Click here to go to Table of Contents
Tuesday, September 12, 2006
Bush Approval: Gallup at 39%

A new USAToday/Gallup poll finds approval at 39% with disapproval at 56%. The poll was conducted 9/7-10/06. This is a 3 point drop from Gallup's previous reading at 42% 8/18-20, but is in line to a series of six previous Gallup polls between 37% and 40% taken over the summer. Gallup concludes that approval has been stable for the last six or so polls.
With the addition of the Gallup data, my trend estimate stands at 39.8%. The upward trend that has developed since mid-August continues with the addition of this new poll.
The effect of President Bush's address to the nation on Monday night, 9/11, is yet to be addressed. In November 2005, approval increased after the White House began a month-long defense of it's policy in Iraq. The speech last night had many of the same elements, and fits well with the reported strategy of turning the "war on terror" into a positive for the fall campaign. Others argue that this well of support is beginning to run dry. Given that the current upturn (I called it a "surge" yesterday; one of my correspondent's argued for "creep". So let's try the more neutral "upturn" today) is well established prior to the speech, it will be important not to confound continuation of this increase with an effect of the speech itself. As with all analysis here, we'll have to see some 6-12 post-speech polls to get a decent handle on the effect that address may have had.
Click here to go to Table of Contents
Monday, September 11, 2006
Bush Approval: Surge continues, ABC at 42%
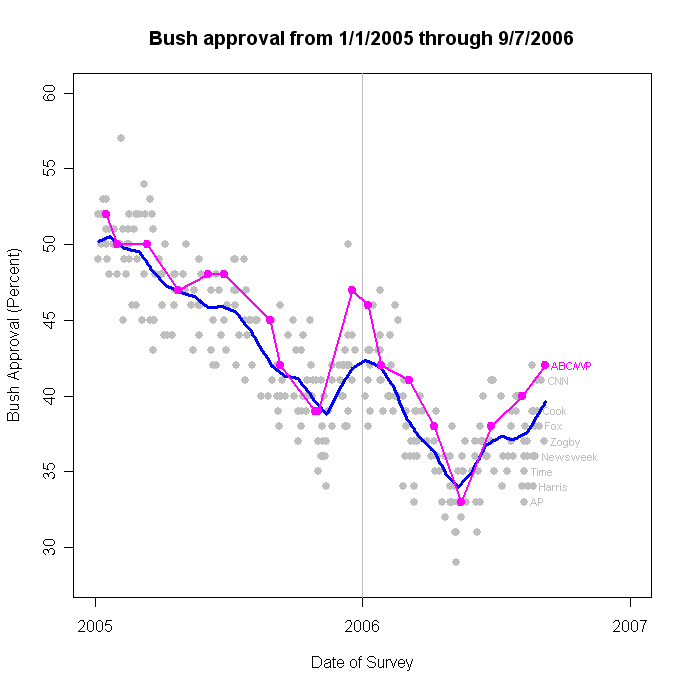
President Bush's approval continues to surge with the latest ABC News poll (9/5-7/06) finding 42% approval and 55% disapproval. With this latest poll included, my trend estimate has now risen to 39.7%, an increase of over 2% since the summer plateau around 37.2% or so. This upturn began around August 1, with the sharp upturn taking place after August 15. The last time approval was above 39.7% was February 19 when it was 39.8. (Close readers will recall that in June the approval trend momentarily passed 40%, but that lasted only for a single poll and subsequent revision of the summer approval trend shows it never in fact rose above 37.5.)
This is a remarkable run-up in approval over a 3 week period. I have been cautious about the increase, anxious to see more polls check in. Those that have, so far, have only strengthened the conclusion that the President's standing is indeed improving. The aniversary of 9/11 will likely produce a number of new polls, which should give us a very wide range of data to strengthen this estimate.
Over the summer the trend moved up a bit, down a bit, and was flat for a bit. And revision of the series often showed that the short term movements were more due to the influence of a single poll or two rather than a demonstrable and sustained trend. This move certainly looks more sustained over a number of polls and over three weeks.
The 9/11 aniversary, and the President's speech tonight, are opportunities for the White House to further strengthen it's hand as it plays to its long terrorism suit. If Democrats have a stopper, they have yet to play it. (Apologies to the non-bridge players out there. I just can't resist the analogy.)
Compared to May, when the approval trend fell below 34%, President Bush has enjoyed a more than 5 point rise in approval. What looked like looming disaster for November, with a President in the low 30s or even the high 20s, now looks like a midterm with a President who has low, but not disasterously low, approval ratings. The current handicapping by Charlie Cook and others is that the Democratic position has strengthened in a number of House races, with some analysts suggesting a 20+ seat gain is not out of the question for the Democrats. If that happens, it will have much to do with the strength of the local candidates, and rather less to do with a wildly unpopular president.
Click here to go to Table of Contents
Subscribe to:
Posts (Atom)