Tuesday, December 12, 2006

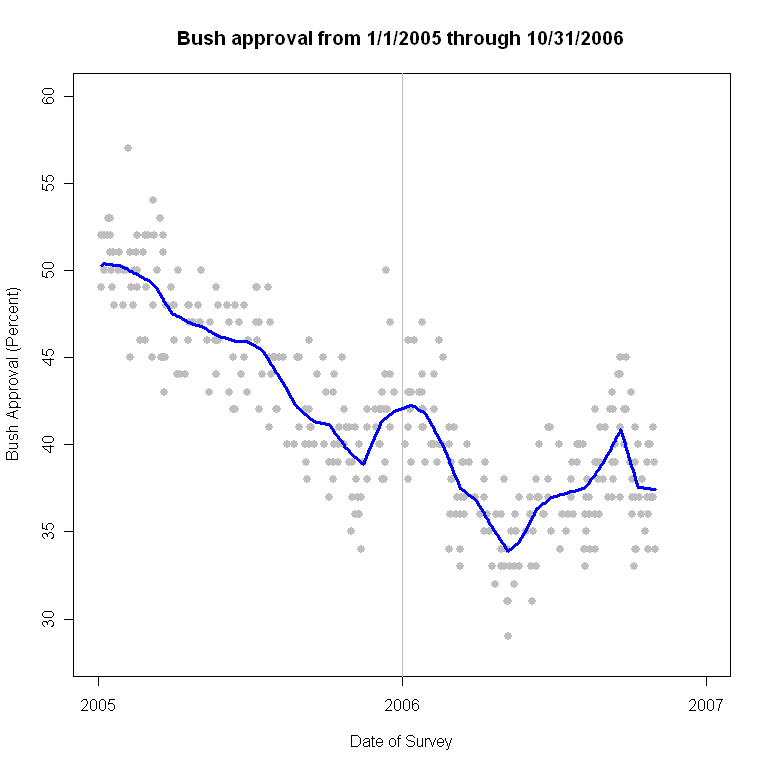
Bush Approval: Gallup 38%, ABC/WP 36%


Two new polls by Gallup and ABC/WP raise the trend estimate to 34.4%. The "new low" due to CBS last night didn't last long. More commentary later.

Monday, December 11, 2006

Bush Approval: CBS/NYT at 31%, Trend at 33.2%


With the addition of the CBS/NYT poll out today (approval 31%, disapproval 63%) the President's approval trend has fallen below the previous low of 33.7, to a new low of 33.2%.

While the CBS/NYT poll is in line with recent polls by Harris, Zogby and Newsweek, it is a good deal below other recent polls by Fox and CNN. The trend line is sensitive to the most recent polls, especially when trending down like this, so some caution is in order.

The worst news in the CBS/NYT poll is that approval among Republicans has fallen considerably, to 65%. Strong Republican support has been the crucial element keeping approval in the upper 30% range. If losses there continue, there could be a substantial drop in approval. Iraq approval appears to have especially suffered in this way. Approval of Bush's handling of Iraq has fallen from 29% to 21% since 11/14, and among Republicans the President's Iraq approval rating has fallen from 70% to 47%, an astonishing drop. This is in the immediate aftermath of the Iraq Study Group report, and strong negative reaction among the most conservative elements of the party. Perhaps the ultimate White House response will appease these critics, though at what price in support among other Republicans?

Approval of President Bush, 2001-present

Updated 11/8/07


This graph shows approval of President Bush throughout his term in office. It is updated in place here for easy bookmarking or reference. For commentary on the approval ratings, see items with the label "presidential approval".

Approval of President Bush in the Second Term

Updated 11/8/07


This figure is the current estimate of approval of President Bush during the second term. It is updated in place here for easy bookmarking or reference. See other blog entries with the label "presidential approval" for commentary related to this topic.

Sunday, December 10, 2006

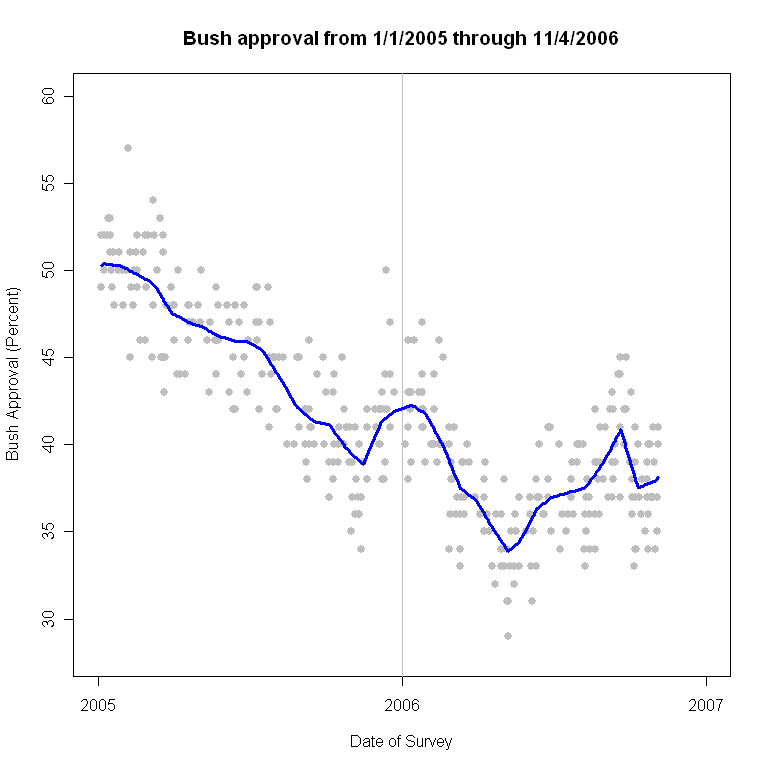
Bush Approval Trend Slips to 34%


President Bush's approval rating has fallen to 34% in my trend estimate. This is just barely above his all time low trend estimate on May 13, 2006. New polls included in this estimate include results from Fox (38%, 12/6), CNN (37%, 12/7), Marist College (37%, 12/3), AP (33%, 12/6), Newsweek (32%, 12/7) and Zogby (30%, 12/8). While the range from 30% to 38% may seem substantial, it is in fact comfortably within the +/-4.5% range around my trend estimate that we've seen over the Bush administration.

For a comparison of all pollsters, including these new polls, see our new feature at Pollster.com here. That feature will be updated each time I update the approval series and allows you to easily see the trend for each pollster in comparison to my estimated approval trend. (Scroll down to see the thumbnails for each pollster, and click on a thumbnail to see the full sized plot.)

The post-election decline is not surprising, given the election results. However, the White House has to worry that all the gains of the late spring and summer have now been lost. So far it seems unclear to me whether the President will be able to use the Iraq Study Commission report as an opportunity to recover some of his lost approval. And with the holidays approaching, now is perhaps not the most opportune moment to launch a new political offensive. But come January and the start of the new Congress, the President will certainly need some improvement with the public to help him confront the Democratic Congress. This assumes, of course, that the White House will have an agenda to press in the new year rather than retreat to a purely defensive stance vis a vis Congress.

On a technical note: This post marks the debut of new graphical formats for the approval series. A number of readers have asked for background grids for the charts, and I've finally found a color combination that I think works. The vertical grids are marked in quarters, with monthly tic marks on the x-axis. New years are marked with a slightly darker vertical grid line to help keep years straight. And the trend estimate is now printed right at the top of the table for convenient reference. (And yes, ego has overcome modesty and the graphs now say where they are from.)

The most important change from my point of view is that the "current" approval graph has now been scaled to run throughout the second term. I've written about why it is important to maintain a consistent scale to these graphs here. In practice I've used 2005 and 2006 for the second term up until now so the graphs wouldn't look too empty. But with the second term now half over, I think it is a good moment to shift to a full four year view. From now on, the current approval will be plotted in this perspective, with new points and trend added to the right of the figure as new data come in. The important thing is that this means the perspective of the trend will remain exactly the same for the next two years, so the rate of rise or fall can be compared just by looking at the figure. Virtually all the plots by pollsters or news organizations change the width of the horizontal axis as new polls come in. That distorts the trends over time because more data "scrunches" up the points and the trend over time. My graph will look the same for the next two years, so it is always comparable.

I've also scaled the vertical axis to run from 20% to 60% approval. We've only seen one poll below 30% in the last 6 years, but that came when the approval trend was just below 34%, as it is now. If the trend declines any more, it is likely we will see some readings in the 20s. This is NOT a forecast on my part, but in order to avoid any further rescaling of the graph, I've expanded the range.

The graph of approval over the entire Bush administration has also been spruced up with a new grid. This chart has always run the full width of a two term presidency and with approval from 20%-100%, so the scaling here has not changed. I've also added the current trend estimate to the top of the graph. The grid here is the same as for the second term: quarterly vertical grids, with darker lines for January 1, and monthly tic marks.


These graphs are saved and updated at the links listed in the top of the right hand column of the blog for easy reference. They are drawn at 768 x 768 resolution, and are best viewed at that. Some users may need to double click on the image to see it at that resolution.

There will be some more new things coming once the semester is finished and grading is done. Stay tuned.

Tuesday, November 21, 2006

Ideology and Republican Losses


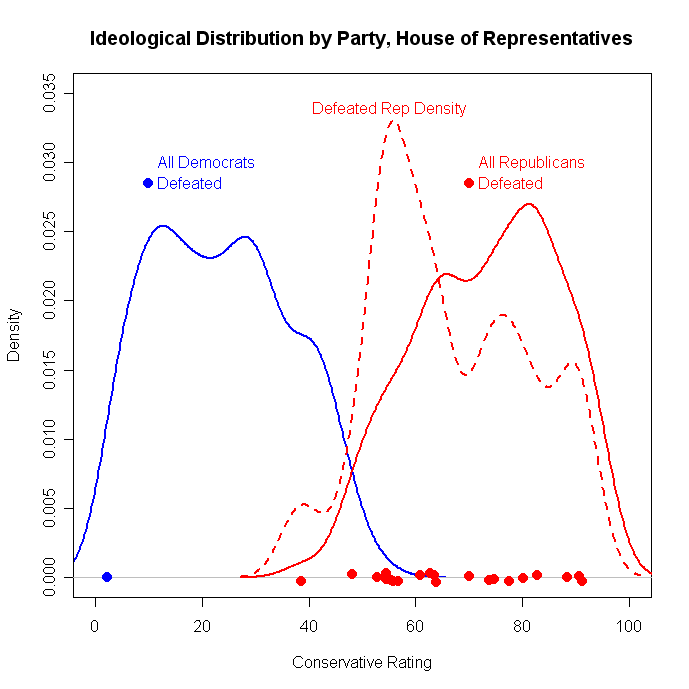
Republican losses fell along most of the ideological spectrum, but were a bit more common among moderates than among the more conservative members of the party. The graph above shows the distribution of conservatism in the House of Representatives by party, using the National Journal ratings. (I use National Journal because it is convenient to grab the data, includes more votes than the typical interest group rating and correlates highly with other (more "political science-y") measures such as Nominate scores. Nominate scores are not yet available for the 109th Congress and I don't have time to compute them myself right now. Readers interested in how Nominate scores are computed should see Keith Poole's excellent site here.)

Republican incumbents who were defeated for reelection had an average conservatism score of 66.5, while those who won averaged 74.3, a statistically significant difference. (The average for all Republicans in 2005 was 73.2, and the median was 74.4.)

This does not mean that Republicans were necessarily more vulnerable BECAUSE they were more moderate. What is left out here is the district. Moderate Republicans are more likely to come from less conservative districts, so this result may well simply reflect the more competitive nature of districts that produce more moderate Republican members. I'll take a look at that later, but for now the simple point is that the election defeat did fall more heavily among representatives with somewhat more moderate voting records.

The one Democratic defeat plotted here is Rep. Cynthia McKinney, GA-04 who lost in the primary. The plot above also includes Republican Rep. Joe Schwartz, MI-07, who also lost in a primary.

Monday, November 20, 2006

Ideological shifts in House Committee Chairs


(I'm still digging out from the ton of stuff undone over the past three weeks, so the Table of Contents is still waiting for an update, and reorganization. But I don't want to delay further some of the new posts I had prepared last week but couldn't post while traveling. So here is a start.)

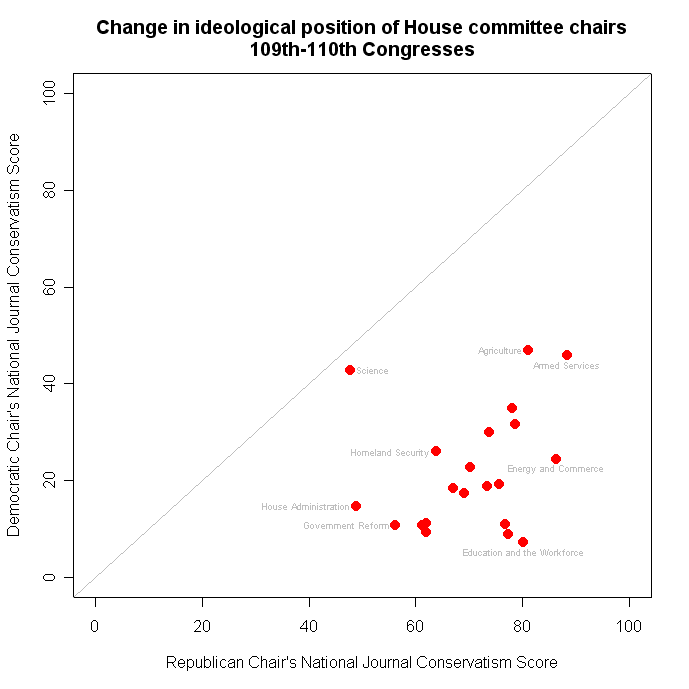
The shift in party control in Congress brings with it new committee chairs. Their outlooks give us one measure of how different the new 110th Congress may be from the 109th. Of course committee chairs are only part of what makes Congress work. We've heard and read that the Democratic leadership does not plan to give free reign to the instincts of the most liberal members. Nonetheless, the shift from generally conservative Republican chairs to generally liberal Democratic chairs is clear. The Science committee is the one substantial exception.

The graph above plots the Republican chair's vs the Democratic chair's National Journal 2005 Conservatism score, where 100 is the most conservative and 0 is the most liberal. I've used the expected chairs as reported by Congress Daily. The Intelligence committee chair appears to be the most uncertain at this point, with Speaker to be Pelosi said to be opposed to current ranking minority member Rep. Jane Harman, (D-CA). I've used Harman's National Journal score none-the-less in this plot.

It is hard to identify the cluster of points to the middle of the graph, so the dotplot below shows the shift to the left for each committee.


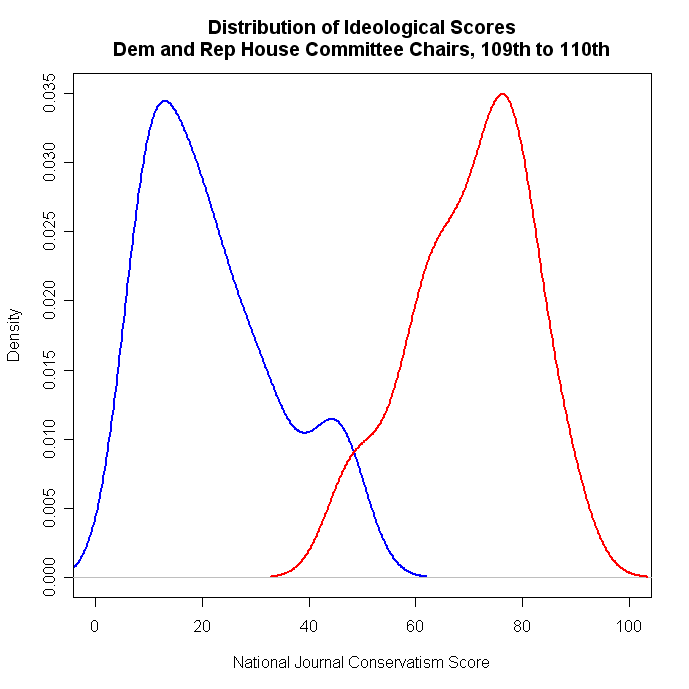
One other way to view this is to compare the distributions of the two party groups, as in the figure below. Here the polarization of the parties, and the modest overlap in the middle, is apparent. This distribution is not unrepresentative of the House as a whole. While the chairs are not an exact match, they are not wildly different from the House as a whole. The Republican chair median conservatism score is 73.3, while that for all Republicans in the House is 74.4. The median Democratic chair's conservatism score is 18.8 while the median for all Democrats is 23.25.

Friday, November 17, 2006

Bush Approval: 6 Post-Election polls


I'm finally back from nearly three weeks on the road. I'm one flight from home returning from Germany where my network connection seemed cursed at hotel after hotel after hotel. I'm very much looking forward to being home and getting to the backlog of post-election posts. Here is a downpayment.

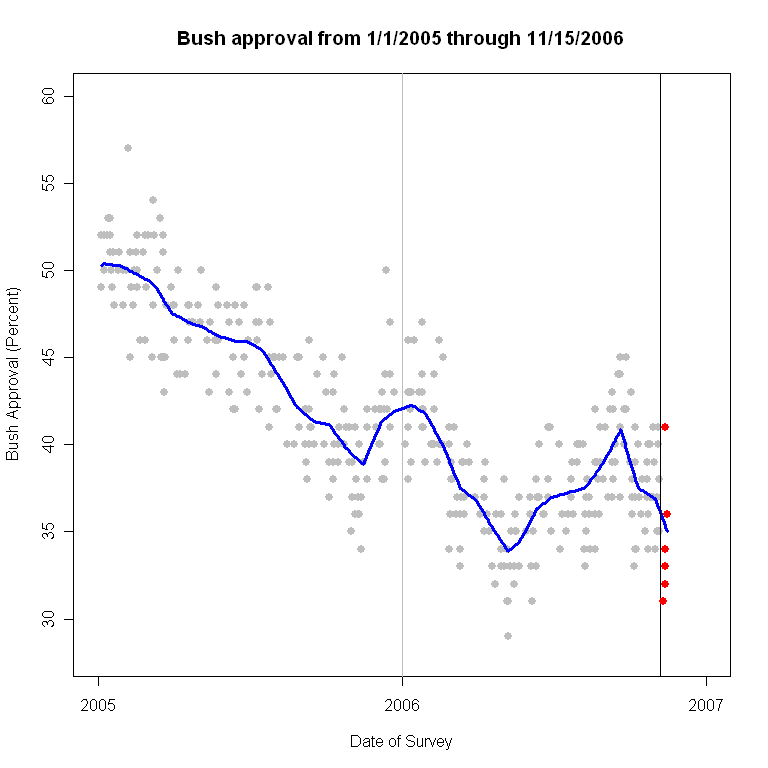
President Bush has suffered a significant drop in approval since the mid-term election. Six post election polls bring the trend estimator down to 35.0%. And that despite one rather high reading at 41%. The huge question now is what happens to presidential approval over the next couple of months leading to the first meetings of the new congress. As it stands, approval is only 1.2 percentage points above the all time low of 33.8% on May 15, 2006. A new downward trend would threaten that record, adding a strongly negative public judgment of presidential performance to the rebuff of Republicans at the poll. A short term downward shock due to the election that quickly stabilizes would not be a strong endorsement but would certainly be better for the White House facing the new congress. How such a stabilization, or even a new upward trend, can be engineered is a problem for the President's political advisers.

Time to run for that last flight to Madison. More after a good night's sleep.

Tuesday, November 07, 2006

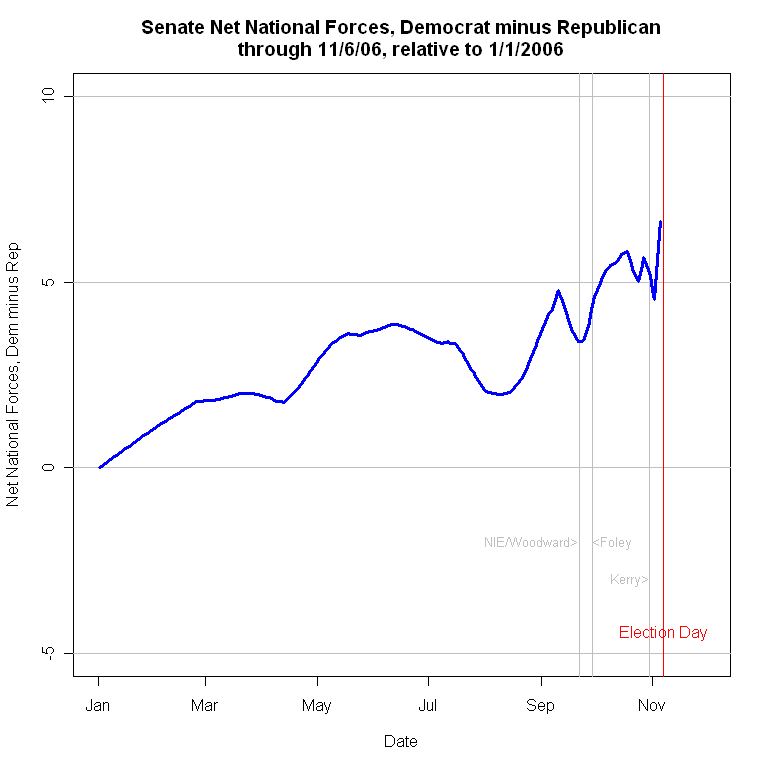
National Forces: In Flux at End


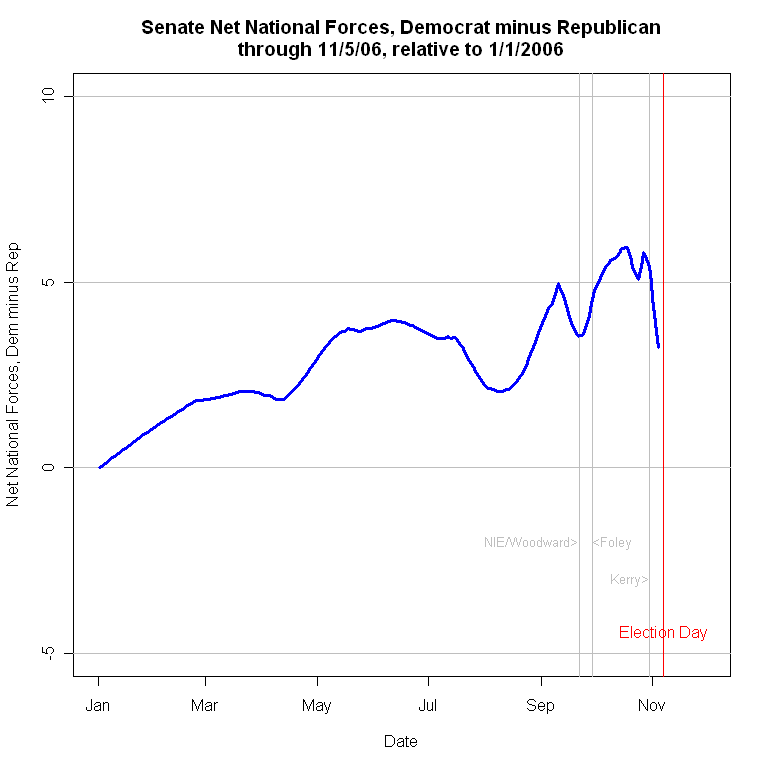
My estimate of net national forces is moving again, but is it signal or noise? We'll know after tonight. With the last polls, through 11/6, the Senate estimate has turned back up. I HASTEN to add that this estimator is sensitive to the last points of data and can take some time to make up its mind about the trend. We have no more time, so here is what we've got. Perhaps the Republican surge ended over the weekend, and perhaps the upturn here is just a fluke of the last polls that came in. I HAVE made this a pretty conservative estimator, not TOO sensitive to short term noise, but with no more data after today it will be hard to know about the last couple of days of th campaign. Perhaps I'll be able to do more on that after the election, when only academics like me care about such things.

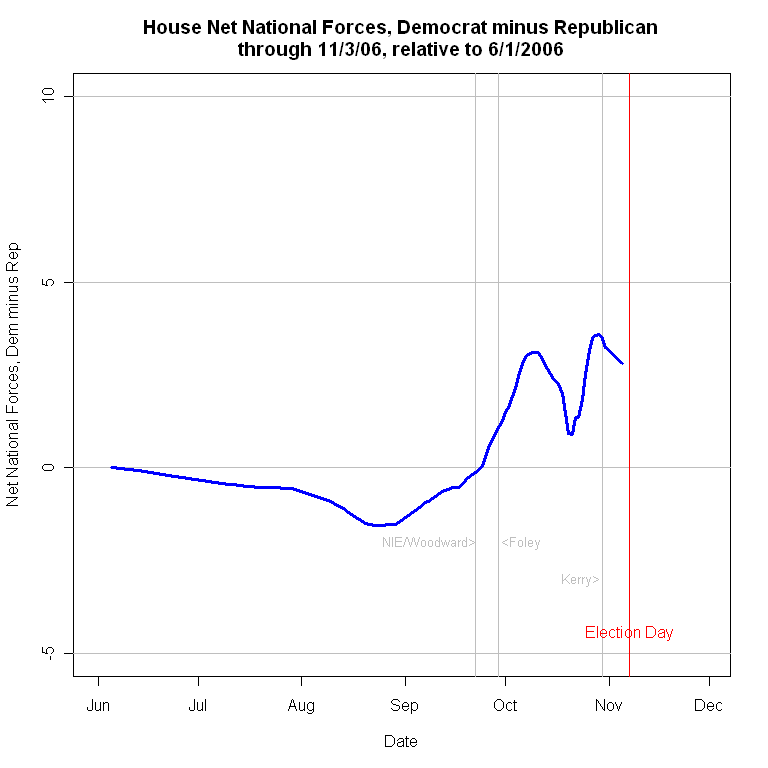
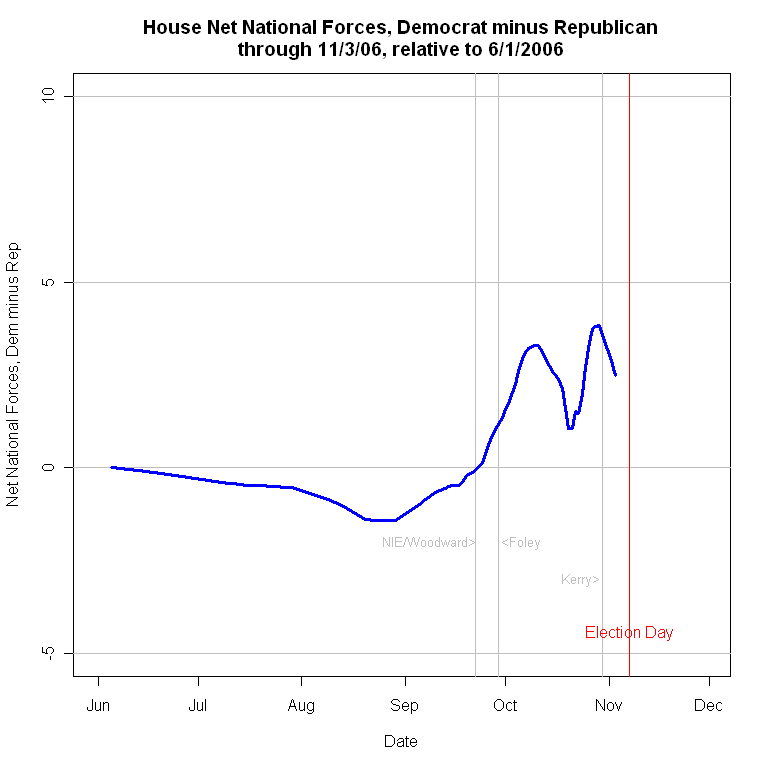
The House does not show the same upturn, but does show a change in the slope of the decline, perhaps reflecting a similar upturn in pro-Dem forces, but with fewer House polls we can't detect it.

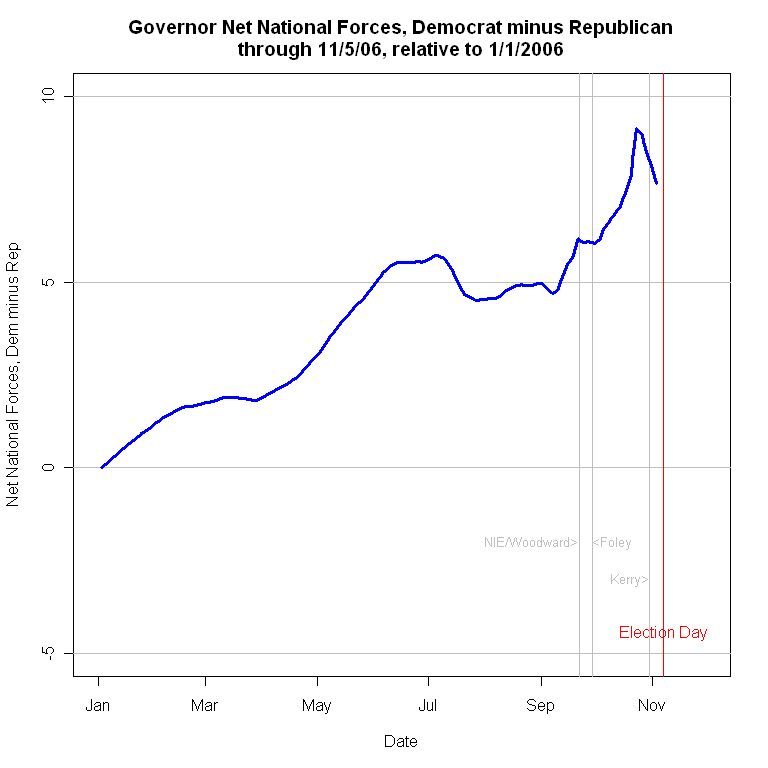
The Governors races (bottom figure) don't seem to show any change in national forces.

Make of this what you will. And have fun with election day and election night.


Monday, November 06, 2006

Bush Approval 2nd Lowest at Midterm


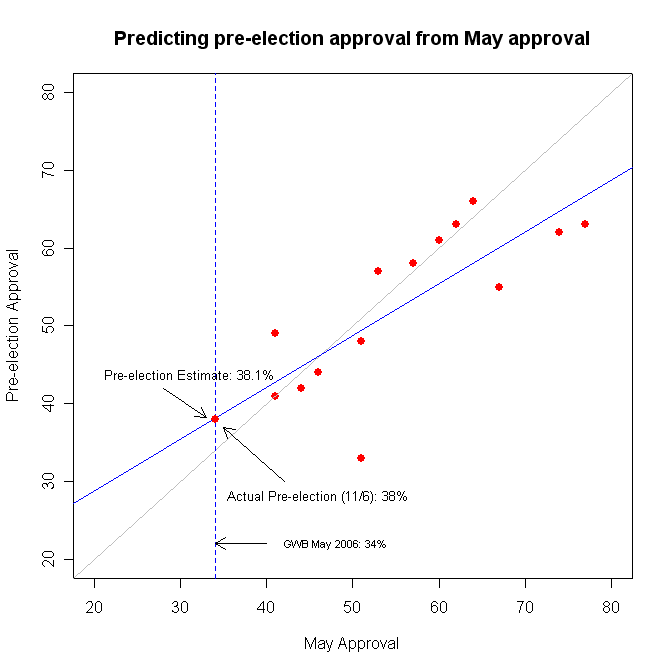
The last Gallup pre-election poll puts approval of President Bush at 38% (and disapproval at 56%.) As the figure above shows, this is the second lowest approval at midterm of any president since World War II. In previous years, such low approval would be expected to lead to major losses in congress. Whether due to redistricting or something else, few forecasts anticipate losses of the magnitude such an approval rating alone would suggest. Current estimates range from the 20s to the high 30s, with a few above and (even fewer) below that range.

Back in May I wrote about approval and midterms and estimated a forecast of approval in the last pre-election poll based on approval in May. The plot below is from that post, with the actual approval rating added. Not bad for predicting the future more than 5 months out.


Click here to go to Table of Contents

Bush Approval: Three polls, trend at 37.8%


The last three national pre-election polls put the approval trend estimate at 37.8%. The polls by Fox, CNN and Gallup find approval at 38%, 35% and 35% respectively. All three polls completed interviewing on 11/5.

There isn't anything new to say. This approval level is terrible in historical context for a midterm election. What effect? We'll see tomorrow.


From Poll Margin to Wins: Polls as Predictors


The usual way to look at poll accuracy is to subtract the poll result from the vote result. But an alternative is to look at how the probability that a candidate wins depends on the margin they have in the pre-election polls. Since American elections are "winner-take-all" within districts, this is a good way of looking at the practical power of polls to predict winners.

After all-- a statistician would say a poll was better that predicted 51% for the loser who actually got 49% than a poll that predicted 51% for the winner who got 55%. That's right from one point of view, but not from the perspective of predicting winners right. Here I take a look at the latter view of what is important.

The data are from all statewide polls for Senate, Governor or President from 2000 and 2002.

The figure above plots results by poll margin. The x-axis shows the Dem minus Rep margin in the polls. The y-axis plots the percent of races the Dem ACTUALLY won for each margin we saw in the polls. So imagine I take all polls that found a 5 point lead for the Dem. The y-axis plots the proportion of those polls with a 5-point lead in which the Dem actually DID win. I do this separately for each race, Gov, Sen and Pres. The dots show there is a lot of variation, but the pattern of points, and the black trend line through the data show how the predictive accuracy varies over margins from -30 to +30.

One interesting feature is that a margin of zero (a tied poll) produces a 50-50 split in wins with remarkable accuracy. There is nothing I did statistically to force the black trend line to go through the "crosshairs" at the (0, .5) point in the graph, but it comes awfully close. So a tied poll really does predict a coin-flip outcome.

The probability of a win rises or falls rapidly as the polls move away from a margin of zero. By the time we see a 10 point lead in the poll for the Dem, about 90% of the Dems win. When we see a 10 point margin for the Rep, about 90% of Reps win. That symmetry is also not something I forced with the statistics-- it represents the simple and symmetric pattern in the data.

More practically, it means that polls rarely miss the winner with a 10 point lead, but they DO miss it 10% of the time.

A 5 point lead, on the other hand, turns out to be right only about 60-65% of the time. So bet on a candidate with a 5 point lead, but don't give odds. And for 1 or 2 point leads (as in some of our closer races tomorrow) the polls are only barely better than 50% right in picking the winner. That should be a sobering thought to those enthused by a narrow lead in the polls. Quite a few of those "leaders" will lose. Of course, an equal proportion of those trailing in the polls will win.

So read the polls-- they are a lot better than nothing. But don't take that 2 point lead to the bank. That is a failure to appreciate the practical consequences of the margin for error.


Click here to go to Table of Contents

Sunday, November 05, 2006

Table of Contents

This is a mini-table of contents to take us through the election. It contains only the recent, election focused, posts. Scroll down a ways for an earlier and more extensive table of contents. I'll rationalize it all after the election.

Bush Approval: 4 polls, trend at 38.1% (11/5)

Dem wave crested; advantage shrinks(11/5)

House 06: National forces estimate (11/3)

Senate 06: National forces estimate (11/3)

Senate 06: Four critical races (11/3)

House 06: Generic ballot (11/3)

Governor 06: State of play (11/3)

Bush Approval: 8 polls, trend at 37.5% (11/3)


(From 11/3, ca 4:00 a.m. Table of Contents):

No time for a full table of contents tonight. I've been busy working to improve Pollster.com with my partner Mark Blumental. We've got a number of nice new features there that make the effort worthwhile, but it has significantly reduced my ability to do the analysis I'd like here. Do take a look at our poll results there, and the "Scoreboards" for Senate, Governor and House races, plus our very complete set of hard to find House polls.

But I hope you'll also read along below for a new analysis of national forces at play in this election, plus reviews of the generic ballot, Senate and governor's races and (at long last!) a presidential approval update.

I'll return to the Table of Contents as soon as I have time, but for now, just scroll down to see the new posts. When you get to the old table of contents, you've gone far enough (though new readers might want to click an item or two for background reading. <;-)

\chf

Bush Approval: 4 polls, trend at 38.1%


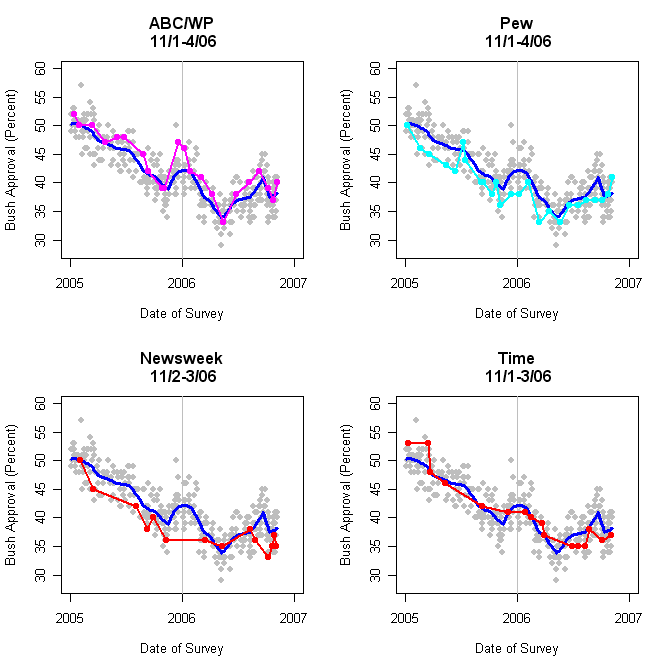
President Bush's approval rating has leveled out after a month of sharp decline. Four new polls, by ABC/Washington Post, Pew, Newsweek and Time find approval at 40%, 41%, 35% and 37% respectively. This puts the trend estimate at 38.1, a small upturn from the last estimate at 37.4%.

While stopping the decline, approval well below 40% is historically quite low and is almost certainly taking a toll on Republican candidates.

The trends of the four polls are shown individually below.


Click here to go to Table of Contents

Dem wave crested; advantage shrinks


Across the board, in Senate, House and Governor's races, the wave boosting the Democrats crested about 10 days ago. Since then the advantage Democrats have built throughout the year has been reduced by from 1.5 to 3.5 percentage points. While forces are still a net positive to the Democrats, these forces are weaker than they were during the week before Halloween. This implies that the most competitive races will now be harder for Democrats to win and easier for Republicans to hold. This implies that the anticipation of a major surge to Democrats now needs to be reconsidered. While race-by-race estimates still show an 18 seat Democratic gain, and 27 seats as tossups (see our scorecard at Pollster.com here), this reduction in national forces makes it less likely the Democrats sweep the large majority of the tossup seats and could result in total gains in the 20s rather than the 30s or even 40s that looked plausible 10 days ago.

This cresting of national forces has taken place across Senate, House AND Governors races and occurred essentially simultaneously around October 25th. The estimators here, plotted as the blue line in the figures, is a measure of national effects that are common across all races. The estimate uses all polls in all races, but estimates the Senate, House and Governors races independently, yet produce similar results for each in terms of timing, though with some variation in magnitude. (For more on the estimation method, see this earlier post.)


As of last Thursday's data, the downturn was clear for the Senate but no indication of change had appeared for the House. Adding the polling data from Friday, Saturday and Sunday, the downturn is now apparent there as well. I did not do the Governors last week.


The congressional generic ballot does NOT show any such change (yet!). In my earlier post I cautioned that the generic ballot might not be reflecting a realistic assessment of the Democratic advantage. It may also not be reflecting the last minute dynamics of the campaign this year.


So what does this mean? The House still looks likely to go Democratic, but probably by a smaller margin that it might have a week ago. For a while, the Senate looked to come down to who won two of VA, TN and MO. Now MT must be added to that, and TN moved to lean Rep, perhaps requiring a Dem sweep of VA, MO and MT. (Momentum in VA remains pro-Dem, while MO is completely flat and MT is strongly trending Rep.) Possible but more of a trick that 2 of the former 3 states. The shrinking margin in MD may well end with a Dem win, but clearly some races that were viewed as likely Dem pickups or holds are now somewhat more in doubt that before, possibly including RI.

With two days to go there is a time limit on this dynamic. Reps may not have time to profit greatly from this trend, and we've seen sharp changes before so Dems may be able to recover (Republicans had a bad end of the week last week, after John Kerry and the Dems had a bad first of the week.) So no firm prediction here, but the evidence is that the Dems are falling back from their best chance of large gains.

Click here to go to Table of Contents

Friday, November 03, 2006

House 06: National forces estimate


I estimated the net national forces in the Senate rate last night. Here is the same estimation procedure applied to the House. This is based on 86 House races with a total of 380 polls. This is much less dense than the Senate data, but the results are surprisingly stable. Unlike the Senate, however, the data do not extend back in time very far, so the starting point here is June 1, 2006. The size of the effects here are also NOT comparable to the Senate forces, since both are estimated independently and the zero point is arbitrary in both cases. Relative movement is meaningful, so it is fine to say that since June 1 the net national forces in the House (for these 86 races) have risen about 6 percentage points.

As with the Senate, this is a good explanation for why so many House seats held by Republicans are now competitive. UNLIKE the Senate, these effects appear to have continued to grow recently. Even a much rougher fit still produces the upward rise at the end. This also is consistent with the growth in the Democratic advantage on the generic ballot, though the details of the dynamics are somewhat different.

The evidence then is favorable to larger than anticipated Democratic gains in the House, but smaller gains in the Senate, at least as of November 3. Four days to go.


Click here to go to Table of Contents

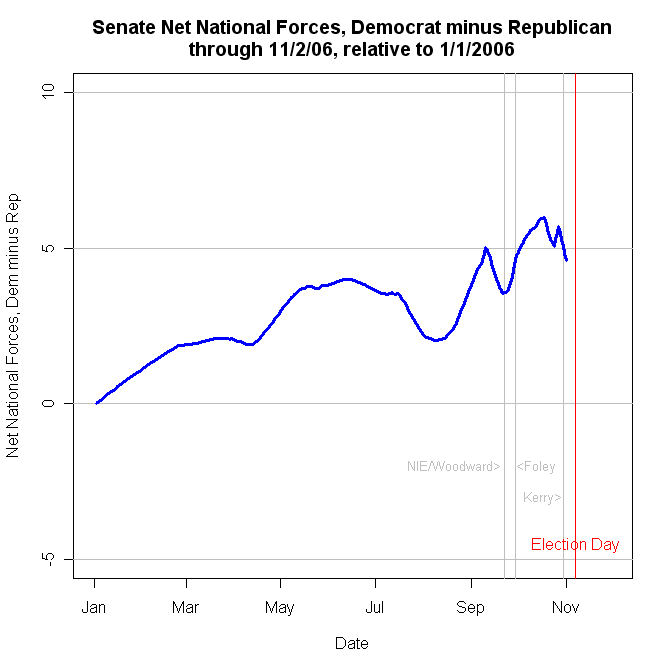
Sen 06: National Forces Estimate


This is certainly a good year for Democrats, but how good? And what are the national forces at work? I can estimate a summary of national forces to answer these questions.

I estimate a model that pools ALL Senate race polls, then iteratively fits a local regression (my usual trend estimator here) while simultaneously extracting a race-specific effect. This procedure has the effect of removing the difference between PA (with a strong Dem lead) and AZ (with a substantial Republican advantage) and likewise for all the states, effectively centering them at zero. The trend estimate that results then will move up if across most states the trend has been up, while if pro-Dem and pro-Rep movements equal one another, the national trend will be zero. There is no fixed metric for this national force, so it is convenient to pick a zero point for identification, in this case January 1, 2006.

The estimator finds that the Democratic margin has grown by 5 points across all races due to this national force. Where Republicans have enjoyed increased support, they have had to do it in the face of this opposing wind, while Democrats who would have been trailing by 5 points if January conditions still prevailed, will now have a "wind assisted" tossup race.

The dynamics of this national force have been generally increasing all year but with significant partial reversals at times. From a June high of about 4 points, this force shank to 2 points in August, then surged to 5 points by September 1. A brief improvement for Republicans took place in early September. At the time Republicans claimed to see new movement in their favor, and these data lend some support for that claim. However, that trend was sharply reversed after September 24 with the first publication and subsequent release of the National Intelligence Estimate followed by Bob Woodward's book, State of Denial. This was followed a week later by the Foley scandal, and once more Democratic advantage increased to about 6 percentage points. In the last two weeks of October there was a brief move in a Republican direction, then back to favor the Democrats. As of November 2, however, the national forces have again moved in a Republican direction, this time somewhat more strongly. While it is tempting to explain this as a result of Sen. Kerry's verbal difficulties, the downturn started before the joke-gone-wrong, so perhaps the Senator does not deserve all the credit for the 1.5 point decline since mid-October. As it stands, the estimate is only a little under 5 points. However, as a national force, common to all races, this decline of even 1.5 points is enough to be crucial for either party in Virginia and Missouri. If it moves more, it could also affect the Tennessee or Montana races as well (and conceivably Maryland.)

For my money, these are sensible estimates of the magnitude of national forces at work in this election. A gain of 5 points in the margin turns a 50-45 race into a 47.5-47.5 tie. Estimates much bigger than this would seem too large to be plausible as they would suggest too many races become competitive or Democratic leads.

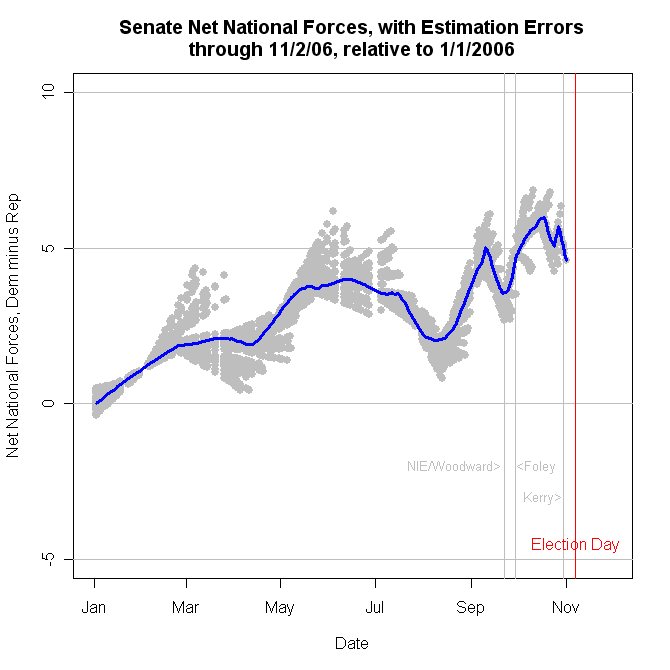
The method I use here does not lend itself to the usual confidence interval estimates. But some sense of the variability of the estimator can be seen below. The estimation errors, indicated by the gray dots, are estimates of where the trend would be IF the series had stopped on the day represented by the dot. This method is sensitive to last observations and while the fit is quite stable when there is abundant data on both sides of a point of interest, it is often a poor predictor of what will come next. The deviations of the gray dots around the line show when the trend would have gone up more, or down more, than the blue trend estimator finally settled on. The errors are worse near points of change in direction, which makes sense. While the variability is not trivial, and indicates considerable uncertainty near changes of trend, the area covered by the gray dots is still relatively small compared to the size of the effect being estimated. The practical implication is that we have to be cautious in suggesting that the current trend will continue, because a change in direction is not well predicted by the model. That said, we can be reasonably confident that the trend estimator would not be radically different if we add more observations. (Which we won't do, after November 7.)


Click here to go to Table of Contents

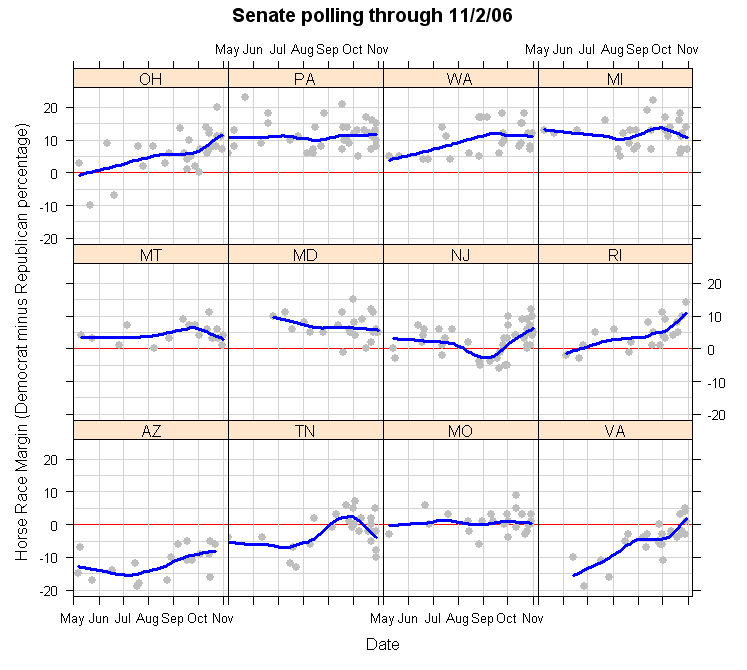
Sen 06: Four Critical Races


There have been some important changes in the Senate polling over the past week. Tennessee now appears to have turned against Democratic Rep. Harold Ford, while Virginia has moved away from Republican Sen. George Allen to a clear tossup. From now on, when people use the term "Tossup" they should show the plot of the Missouri race which lacks trends, bumps, wiggles or hints of what is to come. But the big news of today is the move that has been made in Montana where Democrats were ready to claim (amd many Republicans to concede) Sen. Conrad Burns' seat. President Bush visited and apparently money is now being devoted to this new "firewall" seat. A Burns win would require a Dem sweep of VA, TN and MO to manage a Senate majority. That is obviously a much higher burden than the "2 of 3" wins in these states required with MT in the Dem bag. It is worth noting the Burns is still behind in the trend estimate for MT, but clearly the level of competition has risen, and the odds of a Democratic Senate have shrunk. To make matters worse, in Maryland Democrat Ben Cardin still leads Republican Lt. Gov. Michael Steele but that lead has been shrinking steadily and while the normally Democratic state would be expected to go Democratic, the trend here and in the Governors race (see here) suggest that the Maryland race cannot be assumed to be over. The good news for Democrats (other than in VA) is that New Jersey Sen. Robert Menendez appears to have recovered his lead from Republican Thomas Kean Jr.


So as it now stands, the Dems need 3 of the 4 seats in MT, VA, MO and TN, while holding MD. That may be a tall order, and it makes it likely we won't know control of the Senate until the MT vote is in in the wee hours of Mountain Standard Time. Stay up! It will be fun.


Click here to go to Table of Contents

House 06: Generic Ballot


The generic ballot measure of the House has surged up and not stopped rising since September 22. The surge began the week in which the National Intelligence Estimate (NIE) appeared, followed by Bob Woodward's book, State of Denial. A week later the Foley scandal broke, adding to the move that began a week earlier.

The week or so before the NIE was published there was a small trend in the Republican direction which was remarked on in political news, but this very modest movement was abruptly revered. I would not have thought the NIE or Woodward revelations would have had much effect on mass public opinion, but the timing here is pretty convincing that these did in fact play a role. I speculate that was due to undermining the growth in approval of the administration on terrorism which built in late August and early September, though convincing data of this link is missing. Certainly no such inference is needed with regard to the impact of the subsequent Foley scandal.

The generic ballot is, of course, only a rough indicator of election outcomes (see here, but also see the forecasting efforts of Bafumi, Erikson and Wlezien here and Alan Abramowitz here). I also think the current upturn is a political equivalent of "irrational exuberance" in the sense that the run up in the polls seems likely to seriously overstate the actual vote margin. The current 17 point Democratic margin would be enormous, and even applying the "Charlie Cook Correction" of subtracting 5 points would still imply a 56-44 Democratic triumph. It may happen, but the generic ballot has virtually always overstated the Democratic lead, and this overstatement seems to get worst as the polling margin increases.

For a bit of perspective, the figure below plots the generic ballot since 1994. The conclusion is clear-- the poll measure has not been anywhere near current levels in the past 12 years. The practical result of this remains to be seen, but if Democrats fail to capitalize on this opinion advantage there will be some interesting research to understand why the seat gains fail to respond to this advantage in vote intent (well, in generic vote intent, which isn't the same thing.)


Click here to go to Table of Contents

Gov 06: State of play


Here is a recap of what are (or at least once were!) the competitive Governor's races (AK and ID lack enough data for the analysis and are omitted.) The graph is ordered from the strongest Republican in the lower left corner to the strongest Democratic in the upper right.

Recent action that may affect election day is visible in NV where Republican U.S. Rep. Jim Gibbons is facing allegations of sexual assault. The race had looked strong for Gibbons but has now narrowed, with Gibbon's leading by under 5 points. In Maryland a small but consistent lead for Democratic challenger Martin O'Malley has all but vanished, leaving Gov. Robert Ehrlich a chance to hold on to the office. The reverse has happened in Minnesota where Republican Gov. Tim Pawlenty has lost the small lead he held over Democratic challenger Mike Hatch, with the race now a dead heat. In Iowa, Democratic fortunes have improved to a small lead, as have those of endangered Oregon Democratic Gov. Ted Kulongoski. In Wisconins, incumbent Dem. Gov. Jim Doyle has persistently held on to a small but relatively steady lead, making challenger U.S. Rep Mark Green's chances look longer than many (including me) expected.

No other races give any indication of shifts likely to threaten current leaders. The bottom line should be a considerable gain for Democrats. Our Pollster.com scoreboard shows 28 Dem, 20 Rep with 2 races too close for an assignment. This would give the Democrats a majority of Governorships for the first time since 1994, with potential advantages going into 2008 presidential contests.


Click here to go to Table of Contents

Bush Approval: 8 polls, trend at 37.5%


Over the past 10 days there have been eight new presidential approval polls. (Sorry I've been tied up with Pollster.com and haven't updated as often as usual. I hope to make up for that a little.) The net effect of this new polling is to indicate that the approval drop we saw recently has stabilized but at a low approval trend of 37.5%. That is about where the President stood at the beginning of the summer-- better than the all time lows of May but well below the recent maximum near 41%.

The polls fall above and below that trend, as you can see below. No outliers, though CBS/NYT is relatively low. Bottom line-- low approval for a President at midterm. If a picture is worth 1000 words, let's assume I've got 8,000 words below and let me move on to more posts!


Click here to go to Table of Contents

Monday, October 23, 2006

Table of Contents

This item serves as a Table of Contents to the topics I'm currently covering. Click on an item to jump to it, or scroll down to browse through all the recent posts. (Click a graph, and click again for best resolution.)

Current Approval of President Bush
Bush Approval: Four polls, Trend at 36.2% (10/23) New!
Bush Approval: Three new polls, Trend at 35.8% (10/17)
Bush Approval: Three new polls, Trend at 37.2% (10/13)
Bush Approval: Four New Polls, Trend at 38% (10/10)
Bush Approval: Newsweek 33% (10/7)
Bush Approval: Trend turns down (10/6)
Bush Approval: NBC/WSJ and CNN at 39% (10/2)
Bush Approval: Three polls agree on 42% (9/28)
Bush Approval: Still rising (9/27)

Presidential Approval in Perspective: UPDATED through polling of 10/22/06
See the links to current and historical presidential approval graphs in the column to the right.


Generic Ballot
Generic Ballot: Dem lead widens post Foley (10/10)
Generic Ballot: Decline ends, upturn?? (10/06)
Generic Ballot: Three polls slightly below trend (9/28)
Generic Ballot: After a dip, stable (9/27)

Technical Notes on Local Regression
Many of the "trends" I estimate here use a technique known as "local regression." A very good, not-too-technical description with a good bibliography can be found at the National Institute of Standards and Technology here. For a more technical discussion by William Cleveland, the developer of the technique I use, see his paper here (in pdf). All computation is done in the R
statistical language, an open source, free, program for statistical computing, about which much more here.

Basic Trends: A review of favorite indicators
Generic Ballot: New polls mostly below trend (8/28)
Votes, Seats and the Generic Ballot (8/18)
Generic Congressional Ballot (8/15)
Approval of Bush's handling of terrorism (8/13)
Right Direction/Wrong Track(7/27)

House Races
Hot House Races Lean Dem (9/7)

Hillary Clinton
Hillary's image: 1993-2006 (8/31)

Katrina
Katrina and Bush, One Year Later (8/29)

2006 Campaigns in the States
WI Gov: New polls, same story (8/18) Updated 8/21.
WI Gov: Pollster (and sample) still matters most (7/20)
When the pollster matters most: WI Gov 06 (7/11)
WA Sen: Cantwell-McGavick getting closer? (7/10)
Puzzling Polls in PA Pondered (6/29)

Polling Organizations and House Effects
House Effects and Presidential Approval UPDATED through polling of 8/9/06

Is there a limit to how low presidential approval can go?:
How low can approval go? (3/4)

Historical Footnote
Approval at new low-- for President Truman (7/2)

The problem of detecting change in polls
Up, down or unchanged: Describing poll results (6/17)
"Unchanged since Yesterday": Detecting Change in Presidential Approval (3/26)
New low or steady as you go? Has Bush's fall stopped? (3/23)

Partisanship, Approval and Congressional Elections
Bush Approval: Cook/RT at 39% (8/1)
(This item covers two topics, hence listing it here and under current approval.)

Stem cell opinions and votes
Public support for stem cell research (7/19)

The '08 Contenders
Feingold at home: No censure/withdrawal reaction (7/27)

Conflicting polls
When the pollster matters most: WI Gov 06 (7/11)
Puzzling Polls in PA Pondered (6/29)

Presidential Approval at Midterm
Approval and Midterm Seat Loss: Two Problems (5/10)
Midterm Presidential Approval and 2006 (5/2)

Partisanship and polling:
Party ID and presidential approval (4/5)
Partisanship moves (3/20)
Partisanship across polls (3/2)

Bush Approval: Four polls, Trend at 36.2%


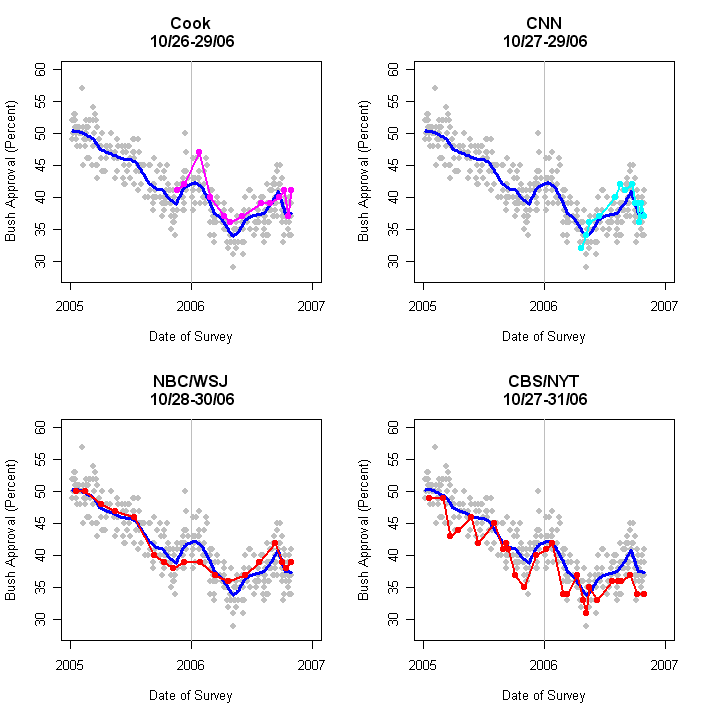
Four more polls in today revise the trend estimate of approval of President Bush to 36.2%. CNN/ORC taken 10/20-22/06 has approval at 39%, disapproval at 58%. ABC/Washington Post, taken 10/19-22/06 has approval at 37%, disapproval at 60%. Newsweek, 10/19-20/06 found approval at 35%, disapproval at 57%. The new Cook/RT Strategies poll, taken 10/19-22/06, got approval at 37%, disapproval at 53%.

The trend estimate is revised up from 35.8% as of polling through 10/15. The trend line (the blue line) remains down because the new data revises the rate of decline, rather than demonstrating (so far) a reversal of the decline. It typically takes 6-12 polls for a change of direction to be clearly revealed by the trend estimate. So far, the data do not hint that a reversal of direction has occurred. For example, the "sensitive" estimator shows a hint of flattening, but no upturn. Since the sensitive estimator is easily fooled, it is too soon to say approval has stabilized. More data this week should help clarify this, however.

The figure below shows the four new polls. All results are reasonably close to the trend estimate. In response to a comment on the earlier item, I reran the analysis of Newsweek's previous poll, which I showed was an outlier, beyond the 90% confidence interval. Repeating that analysis with the new polls included does not change that result. For the time it was conducted, the previous Newsweek poll is still unusually low. Their new poll, in contrast, is well within the 90% CI, as are the vast majority of their polls.

Tuesday, October 17, 2006

Bush Approval: Three new polls, Trend at 35.8%


No time to write this up. Come back for that later. Bottom line: CNN at 36%, Gallup and Zogby at 37%. Trend estimate falls to 35.8% This is a stunning decline that doesn't yet seem to have reached bottom. Can the White House do anything to stop it?

Friday, October 13, 2006

Bush Approval: Three new polls, Trend at 37.2%


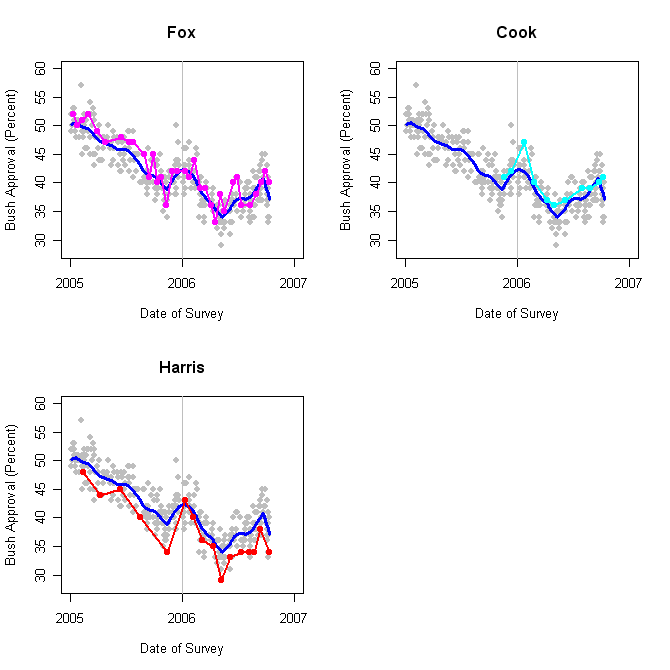
Of three new polls, two place approval of President Bush at or above 40% while one comes in at 34%. Last week's Cook Political Report/RT Strategies poll, taken 10/5-8/06 finds approval at 41%, disapproval at 54%. The new Fox poll from 10/10-11/06 has approval at 40%, disapproval at 56%. And a Harris Interactive poll done 10/6-9/06 puts approval at 34% and disapproval at 64%. (For a plot with just the trend line estimate and the data points, click here.)

With the addition of these new polls, my trend estimate has continued to decline, now standing at 37.2%. Interestingly this trend estimate is virtually identical whether I use my usual "conservative" blue line estimator or the more sensitive (but easily fooled) estimator. While two of these polls are still in the 40s, the Fox and Harris estimates represent declines from their previous result. Cook is a small rise from their previous reading. The current spread of results is consistent with the usual variability around the trend line of approximately +/-4.8%.

An easier to see comparison of the individual polls with the overall trend is shown in the figure below. There are some clear house effects between the polls, but each tracks the trend reasonably well.


Click here to go to Table of Contents

Tuesday, October 10, 2006

Generic Ballot: Dem Lead Widens Post Foley


The post-Foley Folly polls find an upturn in the Democratic margin in the generic Congressional ballot. Prior to the Foley developments, Democrats held a 10.6 point lead in the polls. (This is the Dem percent minus the Rep percent.) That lead has now jumped to 12.8 points, the highest my trend estimate has reached in the 244 generic ballot polls taken this election cycle. This is all the more important because prior to the Foley Fiasco the trend had moved a bit down, then flattened (though still at or about 10.6, a very strong margin even then.) Whatever possible gains Republicans were beginning to make have now been wiped out.

One important concern is that CNN and Gallup produce extraordinarily high values on the generic ballot in this poll. (Remember, these are now down independently-- CNN uses Opinion Research Corporation for it's polling, while Gallup now polls for USAToday only since the dissolution of the old CNN/USAToday/Gallup partnership.) These values of over 20 points are simply implausible given the rest of the data over the past two years, and the other data from the past two weeks. Could it be that my trend estimate is being unduly influenced by these two absurd results?

No. If I exclude the latest CNN/ORC and Gallup/USAToday polls, the trend estimate is a Democratic advantage of +12.4 points, rather than the 12.8 points if these two are included. That small change in trend would still be the highest Democratic margin of the past two years, and when plotted the line without these polls is visually all but indistinguishable from the blue trend line in the figure.

And so we are back to the key question: how much will this huge (compared to elections since 1994) Democratic lead translate into seats? Will we see movement in polls for individual House races move as well? Stay tuned.


Click here to go to Table of Contents

Bush Approval: Four New Polls, Trend at 38%


Four new polls find approval of President Bush has declined substantially since the end of September, following revelations of "overly friendly" email and IM messages from Rep. Mark Foley (R-FL) to pre-adult House pages. All these polls were completed before North Korea tested what appears to have been a nuclear weapon on October 9.

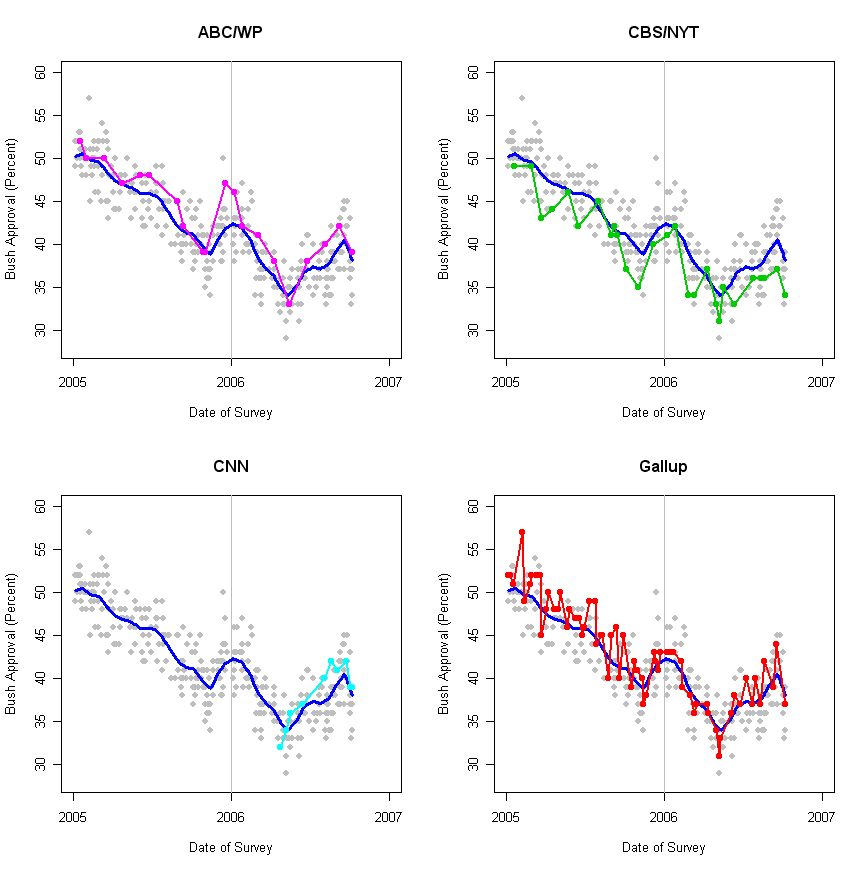
The ABC/Washington Post poll, taken 10/5-8/06 finds approval at 39%, disapproval at 60%. CNN/ORC's poll from 10/6-8/06 also has approval at 39% with disapproval at 56%. The Gallup/USAToday poll (10/6-8/06) found approval at 37%, disapproval 59%. The CBS/New York Times poll (10/5-8/06) comes in low among this group, with approval at 34% and disapproval at 60%.

With these new polls, the approval trend estimate has fallen sharply to 38.1%, a bit more than a 2 point drop since mid-September.

Each of the polls shows a decline from the same poll's previous reading. These are too crowded to plot all four in one image, so here they are by poll.


The CBS/NYT poll is quite low compared to the others, raising the possibility that it is another outlier, as was the Newsweek poll over the weekend. The graph below checks this, and finds that CBS/NYT is NOT an outlier, despite it's low reading of approval. With the new data, Newsweek remains an outlier, though less extreme than before the trend was revised by the four new polls.


The conclusion is obvious. Approval has now given up most of the gains made in the August-September rally.


Click here to go to Table of Contents

Saturday, October 07, 2006

Bush Approval: Newsweek 33%


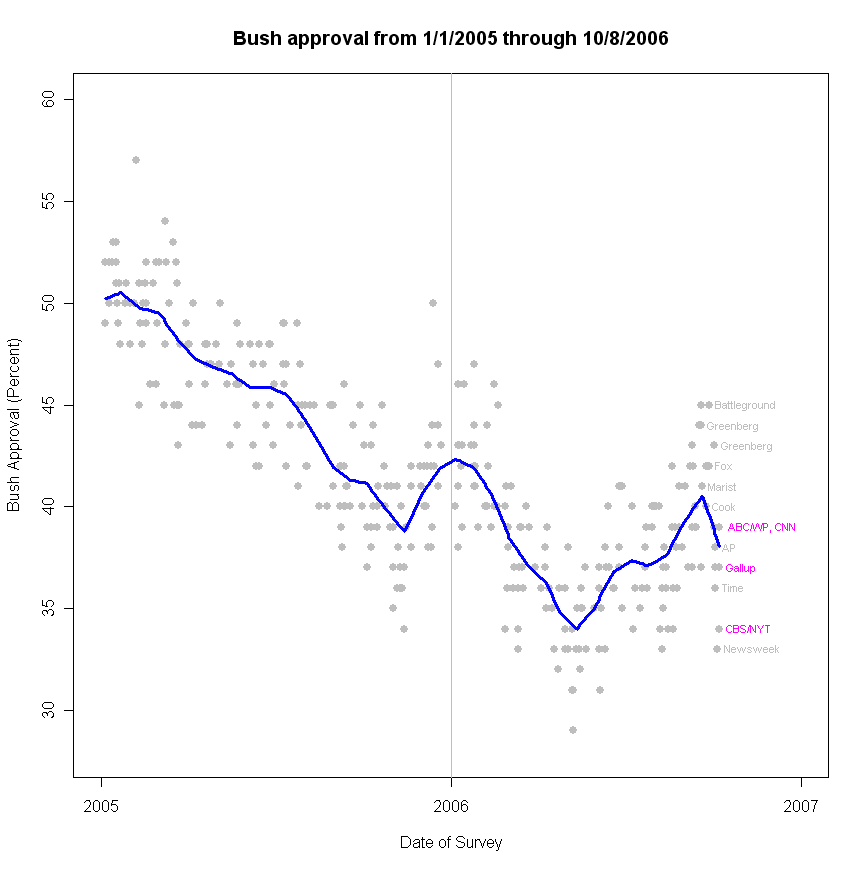
A new Newsweek poll finds approval of President Bush at 33%, a record low for the Newsweek organization, though not for other polls. The poll, taken 10/5-6/06 also found disapproval at 59%. As the graph above makes clear, however, the Newsweek poll is far below other recent polls and the current trend estimate. Before concluding that approval has "really" fallen to 33%, a good deal more data will have to confirm this extremely large drop.

That is not to say that approval has not turned down. Indeed, after the last two weeks of unremitting bad news for the White House, it is hard to imagine how if could have failed to do so. The question is whether the Newsweek poll is a reasonable estimate of current opinion or if it is too far away from other results to be plausible.

With the addition of the Newsweek poll, my current estimate of approval (the dark blue line) stands at 39.4, a full point below the recent high of 40.4 on 9/20. (This value is constantly being revised as new polling allows better estimates of the peak. On 9/19 the estimate was 41.1, while on 9/21 it stood at 41.2. Three polls completed 9/25-9/27 agreed on 42%, driving the estimator that day to 42.2. However, in light of all the polling since, the revised estimate puts the recent high at only 40.4 as of 9/20.)

While a one point drop may seem small, this is a drop in the trend estimate, NOT the very noisy raw polls which move by much more from poll to poll but which also contain much more random variation. One point in 16 days is almost 2 points per month, which is quite a substantial rate of decline. For comparison, during the first five months of 2005, the President's approval declined by one point each 13.5 days, as estimated just before approval reversed and started back up on May 15. I hasten to add that we lack enough data to be at all confident as to what the current rate of decline actually is. One point per 16 days is merely the best guess given current data. It might be less or more and will certainly change as new data come in.

So granted approval is now clearly going down, is the Newsweek poll telling us that the drop is of historic rapidity and that new polls will also show similarly dramatic drops, or is Newsweek's poll a statistical outlier-- getting the direction right but seriously overstating the magnitude of decline?

Based on all polling since 2002, the Newsweek result is clearly a statistical outlier. It is well below the 90% confidence interval in the figure below and is among the larger negative outliers of the past four years. The figure plots the residuals, the deviation from the trend estimate, for each poll taken since January 1, 2002. Orange points are polls that fall outside the 90% confidence interval, indicated by the low and high horizontal lines. The mean of all residuals is zero, the middle horizontal line. Newsweek polls are in red for easy identification.


Newsweek has a good polling track record, producing only one previous outlier in 70 polls. Here "outlier" is any poll outside the 90% confidence interval. By definition, we expect 10% of cases to fall outside that range. In fact, Newsweek has now produced two out of 71 polls since 2002 that are outside that 90% CI, a 2.8% rate. This latest poll, however, is clearly well beyond the lower limit of the interval.

Two recent polls have also fallen outside, but above, the 90% CI. Both of these were completed prior to the revelations about Representative Foley's IM messages to House pages, though after the now estimated peak of approval on 9/20.

Even if we focus on the four polls completed (at least partially) since the Foley Folly began, we see that all four are well below the trend estimate, but that the Newsweek poll is substantially below even these polls.

The conclusion is that the Newsweek poll is implausibly low, given the other data we have seen so far. A possible (but statistically less likely) alternative is that approval is falling very rapidly so that the unusually low Newsweek result reflects a much sharper rate of decline than the 1% per 16 days that I currently estimate. Such a rate of decline would be much higher than any yet seen in the Bush administration. I find this quite unlikely, but the data will answer this one way or another within a couple of weeks. For now, I'd bet the approval trend will fall another half point by the end of next week. If it falls much more than that, the Newsweek poll will look like a harbinger rather than a statistical fluke.


Click here to go to Table of Contents

Friday, October 06, 2006

Generic Ballot: Decline ends, upturn??


I'm between planes so no time for a full post, but the generic ballot that was trending slightly down two weeks ago is now at least flat and perhaps very slightly rising. Too soon to tell what the real effect of the Foley affair will be, but certainly the trend has shifted from down to flat. I'll post more at the next delayed flight (which could be soon.)


Click here to go to Table of Contents

Bush Approval: Trend turns down


More post-NIE, post-Woodward, post-Foley polls are out, suggesting that approval of President Bush has stopped its recent rise and has begun to turn down. Polls from Time, AP and Greenberg find small declines since the previous poll. A Pew poll finds no change. A GWU-Battleground poll is useless for comparison because the previous poll is from February.

The Time poll, taken 10/3-4/06 finds approval at 36%, disapproval at 57%. The AP poll from 10/2-4/06 has approval at 38%, disapproval at 59%. Pew's survey from 9/21-10/4/06 gets approval at 37%, disapproval at 53%. Greenberg/Democracy Corps was in the field 10/1-3/06 and has approval at 43%, disapproval at 53%. The GWU-Battleground poll is a bit stale, conducted 9/24-27/06. It found approval at 45% with disapproval at 53%.

The net effect of these polls on my estimate of approval is a drop of 0.4 points from the peak on September 20 to a current estimate of 40.2%. That peak, however, is also a revised estimate. Without the newer polling, the approval trend had reached 42.0%. The revised estimate of the peak is only 40.6, so recent polling has called the previous high into question. More data will be needed before we can precisely estimate either the September high point or the precise date when the turn in support took place.

While the AP, Pew and Time are generally below the trend estimate, their effect on the trend estimate is balanced by the typically high approval values from the Greenberg/Democracy Corps and GWU-Battleground polls. Likewise the "apples-to-apples" comparison of the plot for each polling organization increases the evidence that there is now a downturn in approval. Obviously we can't yet estimate how large or how sustained this turn may be.

The Pew poll is interesting because it was in the field before the Foley news broke, having collected 777 cases, and then collected an additional 726 cases after the scandal became known. Comparisons of "before" and "after" show an identical 13 point Democratic lead in the generic ballot question, suggesting no immediate impact of the Foley news on vote intentions.

Of course, as with so many Washington scandals, the story is as much about the aftermath of the revelations as the acts themselves. The "what did they know and when did they know it" drama now playing out around Speak Dennis Hastert seems likely to keep the story in the news for at least a few more days. One doesn't need polls to know this has been a bad week for the Republican party. How much that affects polling, and how long such an effect endures, remains to be seen.

For President Bush, the key question is whether he can resume his aggressive campaign efforts and can stay on his message of national security and terrorism. And if anyone is listening to his pitch at the moment. The challenge for Republicans is to change to subject. The challenge for Democrats is to take advantage of the October surprise effectively and to use Foley to advance a broader critique of the Republican congress. Stay tuned!


Click here to go to Table of Contents

Wednesday, October 04, 2006

Bush Approval: NBC/WSJ and CNN at 39%


Two new polls find approval of President Bush has fallen after a week of mostly bad news. The NBC/Wall Street Journal poll, taken 9/30-10/2/06 finds approval at 39% and disapproval at 56%. The CNN/ORC poll conducted 9/29-10/2/06 also puts approval at 39%, with disapproval at 59%. Both polls had registered approval at 42% in their previous readings. These polls come after a week that included debate over a new National Intelligence Estimate's conclusions on terrorism and Iraq, Bob Woodward's new book, and culminating with revelations of Rep. Mark Foley's email contacts with congressional pages. The polling was completed before the Washington Times called for House Speaker Dennis Hastert's resignation as speaker.

The new data do not yet lead to a major change in my approval trend estimate. That currently stands at 41.4%. That's a revision down from 42.0%, but the trend has not yet turned clearly down. The trend line is deliberately conservative, and usually requires 6-12 polls before considering a change of direction reliable. The three point drop in two polls, however, does suggest that President Bush may have suffered a significant reversal over the past week, after some 6 weeks of strong upward movement in approval. It is likely that more new polling will arrive soon, helping clarify how much of this move is a "blip" and how much a harbinger of a change in direction.


Click here to go to Table of Contents